
Figure 3.
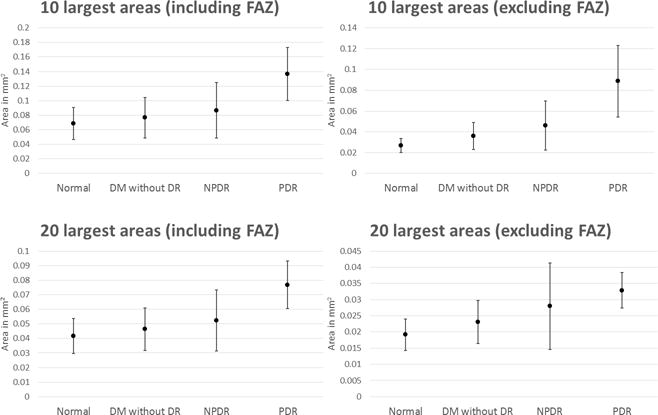
Intercapillary area statistics for each cohort. Points correspond to mean value and error bars correspond to standard deviations.
Official websites use .gov
A
.gov website belongs to an official
government organization in the United States.
Secure .gov websites use HTTPS
A lock (
) or https:// means you've safely
connected to the .gov website. Share sensitive
information only on official, secure websites.
Intercapillary area statistics for each cohort. Points correspond to mean value and error bars correspond to standard deviations.