
Figure 4.
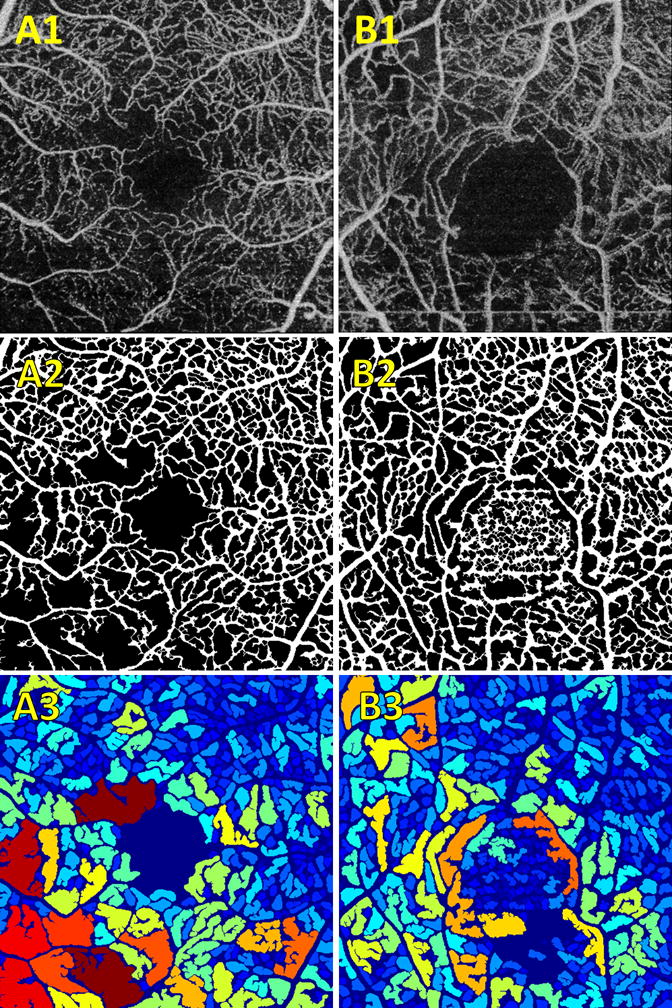
Examples of exclusions. (A–B).1 Contrast enhanced input en face OCTA projections. (A–B).2 Binarized vessel maps. (A–B).3 Intercapillary area maps. (A) Example wherein one region of the image, in this case the bottom left quadrant, has low OCTA signal. As we can see from the corresponding binarized vessel map, this algorithm treated this region as a large intercapillary area. (B) Illustrates segmentation failure wherein excessive noise in a region, in this case the FAZ, causes erroneous segmentation.