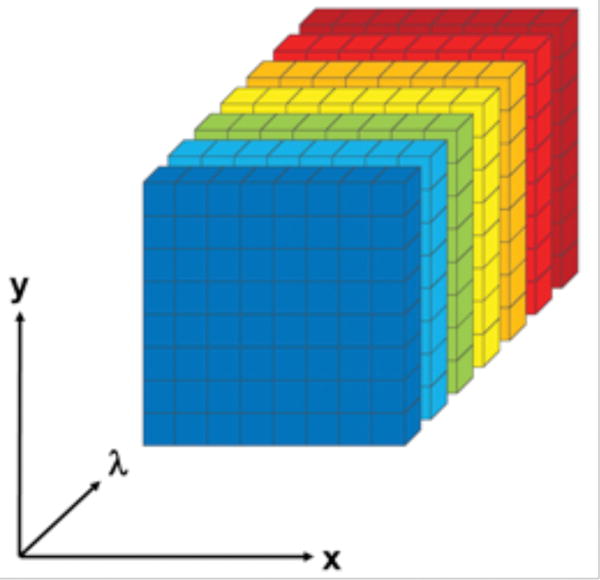
Fig 1. The hyperspectral autofluorescence emission data cube, or “hypercube”.

The hypercube is acquired from a retinal pigment epithelium/Bruch’s membrane tissue oriented in the x,y plane. For each emission wavelength λ, a 2-dimensional image of the tissue, or slice, is acquired, capturing all emissions of the tissue at that wavelength. The 2-dimensional slices (colored by emission wavelength for illustration) are stacked by λ to form the hypercube.
