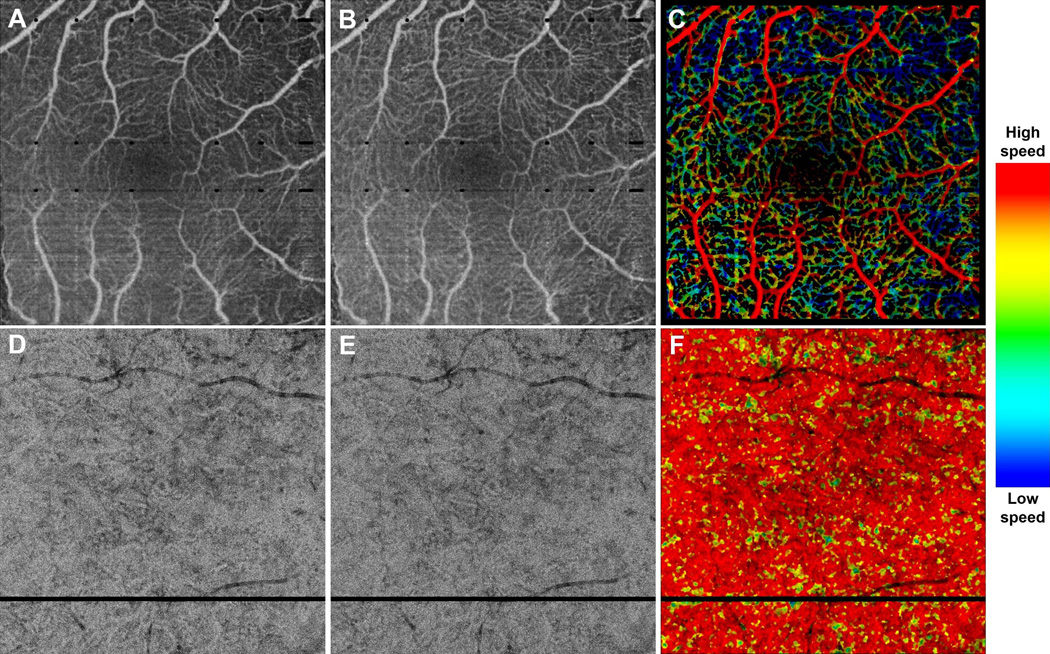
Figure 2.
VISTA visualization in a 43 year old normal patient, taken over (A–C) a 3 mm × 3 mm field of view, and (D–F) a 6 mm × 6 mm field of view. (A) Mean projection of the 1.5 ms OCTA volume through the depths spanned by the retinal vasculature. (B) Mean projection of the 3.0 ms OCTA volume through the depths spanned by the retinal vasculature. (C) VISTA image; red indicates faster blood flow speeds, blue slower speed. Note the blood flow speed gradient, with the larger retinal vessels associated with faster speeds, and the smaller retinal vessels associated with slower speeds. (D) Mean projection of the 1.5 ms OCTA volume through ~90 um slab, lying below the Bruch’s membrane. (E) Mean projection of the 3.0 ms OCTA volume through ~90 um slab, lying below the Bruch’s membrane. (F) VISTA image; red indicates faster blood flow speeds, blue slower speeds. Note the homogenous speed in the CC vasculature. The color bar on the right side indicates the relation between color and blood flow speed. The same color bar is used for all VISTA color images in this paper.

