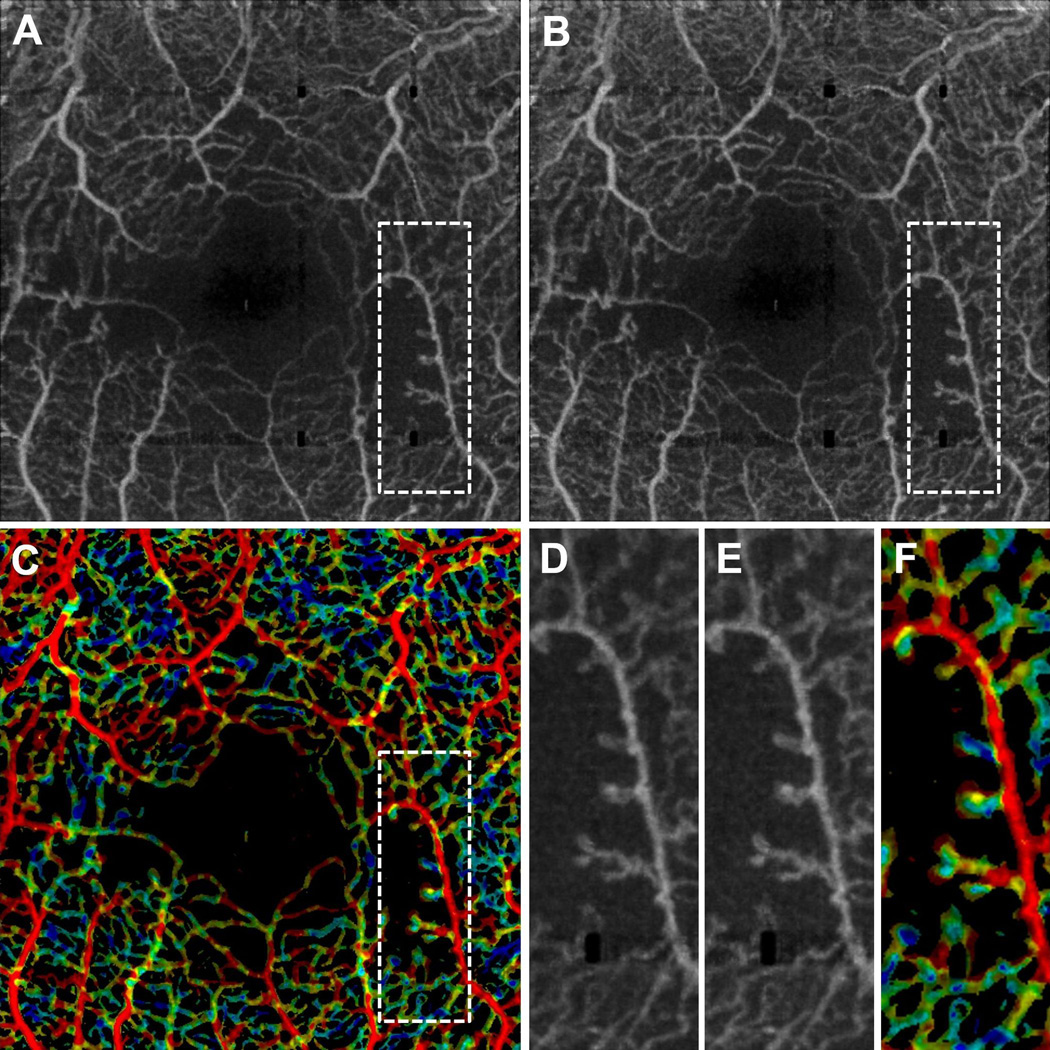
Figure 3.
VISTA visualization in a 53 year old NPDR patient taken over a 3 mm × 3 mm field of view. (A) Mean projection of the 1.5 ms OCTA volume through the depths spanned by the retinal vasculature. (B) Mean projection of the 3.0 ms OCTA volume through the depths spanned by the retinal vasculature. (C) VISTA image; red indicates faster blood flow speeds, blue slower speeds. (D), (E), and (F), are enlargements of the dashed boxes in (A), (B), and (C), respectively. Notice that the capillary loops, which likely correspond to microaneurysms, are associated with slower blood flow speeds.

