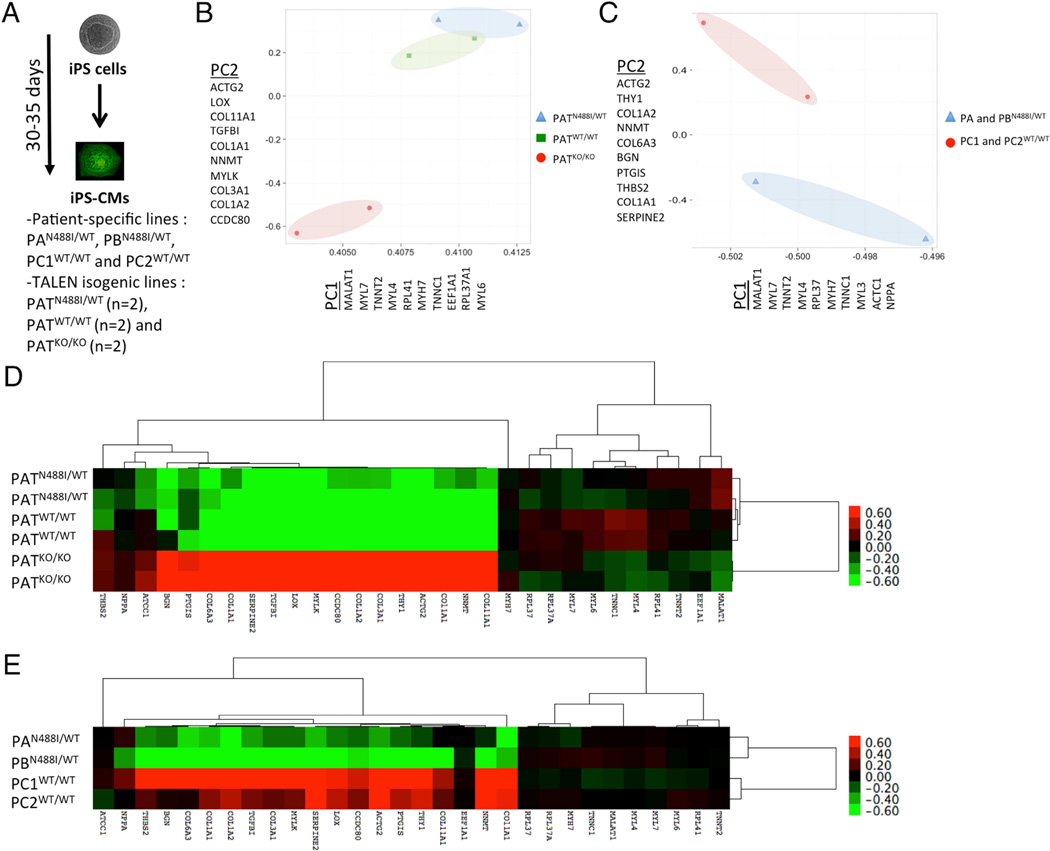
Figure 3. Gene expression analysis by RNAseq of TALEN and P-S iPS-CM models.
(A) Experimental design of RNA sequencing for purified P-S and TALEN isogenic iPS-CMs (pooled triplicates for P-S, and duplicates of pooled triplicates for TALEN isogenic). (B) Unsupervised principle components analysis (PCA) of all TALEN isogenic and (C) P-S iPS-CM gene transcripts separates cell populations by genotype by principle components 1 (PC1) and 2 (PC2). Gene components of PC1 and PC2 are identified by official gene symbol. A heatmap displays 30 gene transcripts from all PC1 and PC2 components for (D) TALEN isogenic (n=6 pooled triplicates) and (E) P-S iPS-CMs (n=4 pooled triplicates). Gene transcripts and iPS-CMs were organized by hierarchical clustering.

