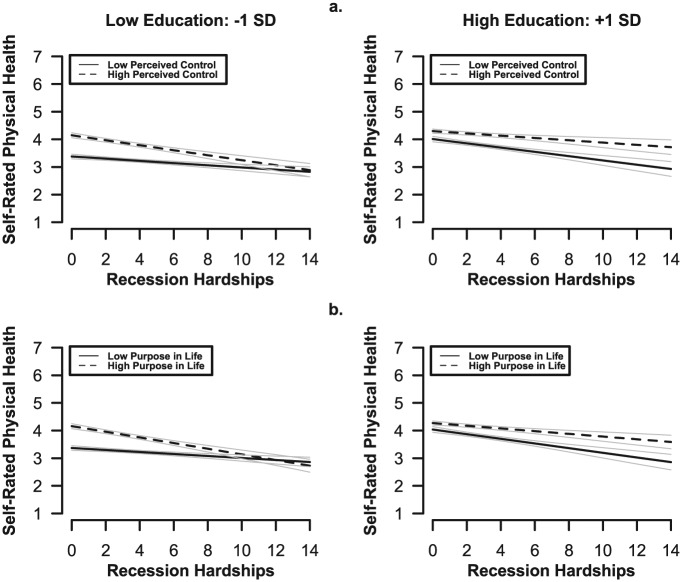
Figure 1.
(a) The top panels depict the significant three-way interaction between perceived control, educational status, and recession hardships for self-rated health (1 = poor and 5 = excellent). The left panel represents model predictions for self-rated health graphed at 1 standard deviation (SD) below the mean for education. The right panel represents model predictions for self-rated health graphed at 1 SD above the mean for education. Solid lines represent model predictions by perceived control (1 SD below the mean) and dotted lines represent model predictions by high perceived control (1 SD above the mean). Confidence interval bands (±1 standard error of point estimates from generalized linear model (GLM)) are provided to indicate the precision of the point estimates across the observed range of number of recession hardships reported (0–14) and (b) the bottom panels depict the significant three-way interaction between purpose in life, educational status, and recession hardships. The left panel represents model predictions for self-rated health graphed at 1 SD below the mean for education. The right panel represents model predictions for self-rated health graphed at 1 SD above the mean for education. Solid lines represent model predictions by low purpose in life (1 SD below the mean) and dotted lines represent model predictions by high purpose in life (1 SD above the mean). Confidence interval bands ±1 standard error of point estimates from GLM) are provided to indicate the precision of the point estimates across the observed range of number of recession hardships reported (0–14).

