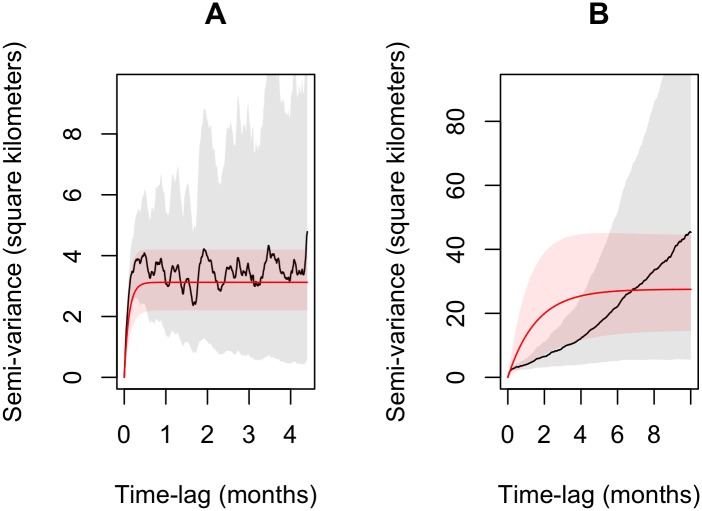
Fig 2.
(A) Variogram of a resident jaguar. Notice that the animal’s semi-variance reaches an asymptote within a few days, roughly representing the time to cross its home range. The red line represents the fitted model and the red shading represents the 95% CI. (B) A non-resident jaguar. Note the lack of a clear asymptote despite the fact that the animal was monitored for a long period (591 days). This lack of asymptote indicates that this animal is not range resident and thus a home range analysis for this individual is not appropriate. For both A and B, the fraction of the variogram displayed is 65% of the duration of each dataset.

