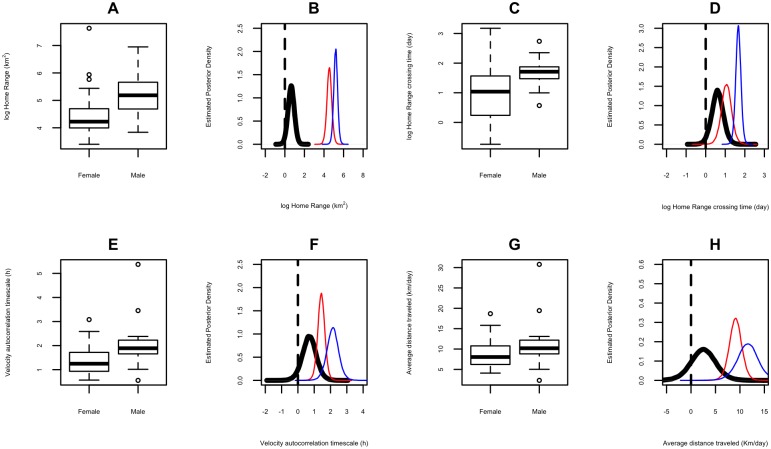
Fig 3. Boxplot and Posterior Density Estimates for male and female home range (log km2) [A and B], home range crossing time (log days) [C and D], velocity autocorrelation timescale (h) [E and F], and average distance traveled (Km/day) [G and H].
Black line represents the difference between the posterior distribution of males and females, red represents the posterior distribution of females and blue represents the posterior distribution of males.

