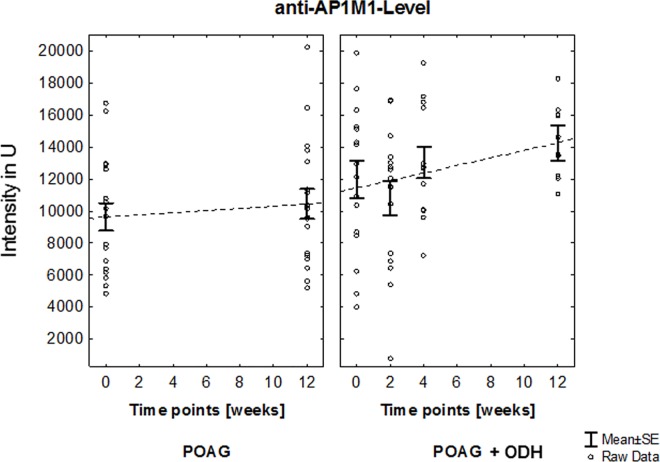
Fig 4. Longitudinal trend analysis of anti-AP1M1 level.
Linear increment of ab-level after study inclusion in POAG + ODH patients with r-value ≥ 0.8 could be shown. Referring to time point 1 an increase of 19% in ab-level could be detected at the end point of the study at time point 4 (12 weeks after screening time point). In contrast, no relevant changes could be detected in the POAG group in the same time period. Additionally, time point comparison between study groups revealed statistically significant higher level of anti-AP1M1-level in POAG patients with ODH at time point 4 (p = 0.01,Student’s t-test).

