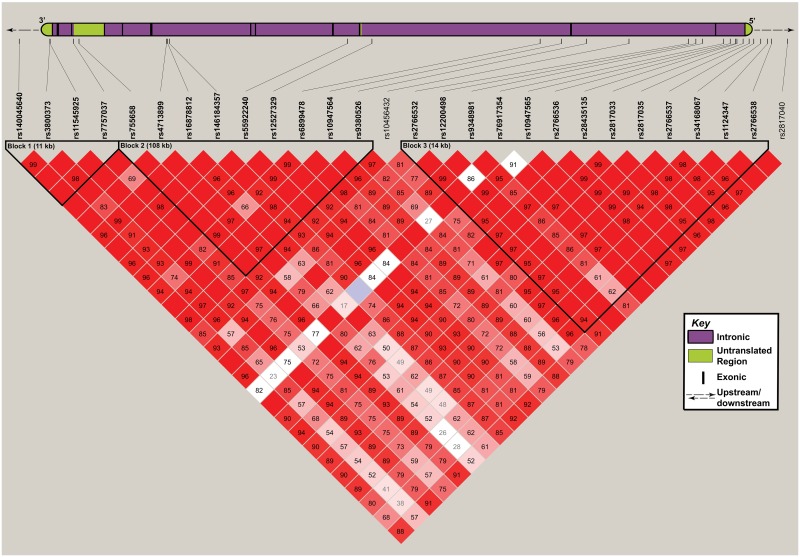
Fig 2. Haplotype block structures in the FKBP5 region.
A collated version of all FKBP5 transcripts is represented at the top of the figure. Vertical black lines represent exons, green boxes represent untranslated regions and purple boxes represent intronic regions. The numbered squares display the D’ score, unnumbered squares have a D’ score of 1.0. Three haplotype blocks were generated and are enclosed by black lines. Lines connect the variants to their approximate location within the FKBP5 locus.

