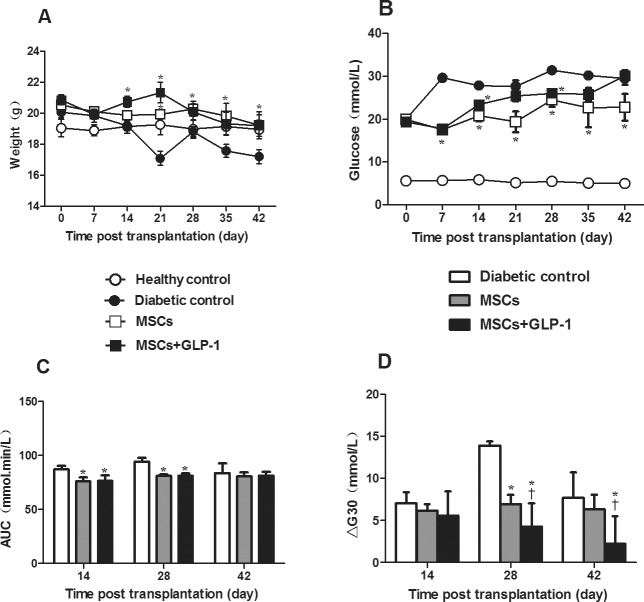
Figure 2.
GLP-1 enhances MSC-mediated glucose tolerance in diabetic NOD mice. Following MSC infusion and GLP-1 treatment, the body weight and FGB levels of individual mice were measured weekly. The AUC and ΔG30 levels in individual mice at the indicated time points post treatment were determined. Data are expressed as the mean ± SEM of each group (n = 6 per group). (A) Body weight. (B) FBG levels. (C) AUC. (D) Plasma ΔG30 levels. *P < 0.05 versus diabetic controls. †P < 0.05 versus mice treated with MSCs alone. AUC: values of the area under the curve for the levels of blood glucose over the IPGTT period. ΔG30: net increase in the levels of blood glucose at 30 min post glucose challenge.

