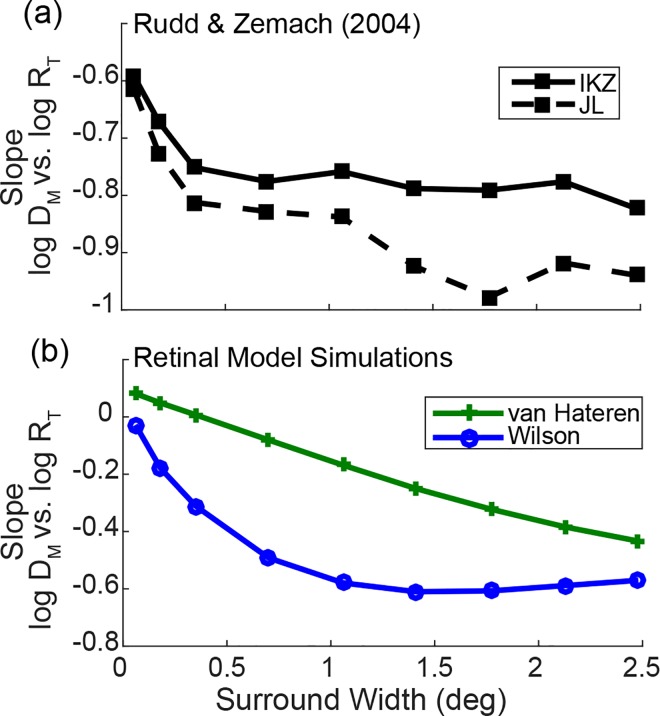
Fig 8. Behavioral and simulation results of Rudd and Zemach’s experiment [39].
(a) The behavioral data on the slope of the log match disk luminance vs. log target ring luminance for two subjects, IKZ and JL (see text for details). (b) The simulation results for the same experiment. The green line with ‘+’ markers represent the result of van Hateren’s model and the blue line with ‘o’ markers represent the result of Wilson’s model.

