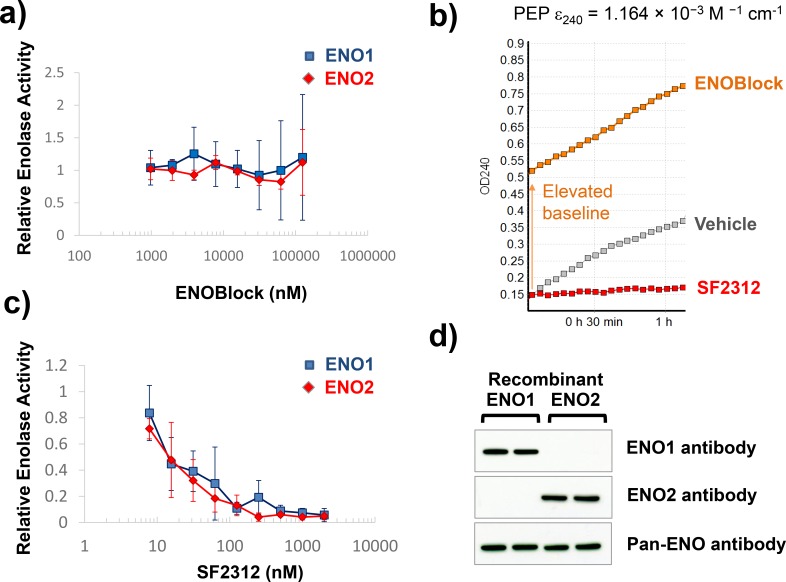
Fig 2. Effect of ENOblock on Enolase activity using spectrophotometric detection of PEP.
The effect on ENOblock (a) and SF2312 (c) on Enolase activity in purified recombinant ENO1 and ENO2 was determined using the direct PEP-detection assay. Panels a and c show enolase activity normalized to vehicle control and expressed as a function of inhibitor concentration. Each data point represents mean of N = 4 ± S.D. Panel b shows a representative traces of absorption at 240 nm over time of vehicle control; 62,000 nM ENOblock and 100 nM SF2312. Note the increased baseline with ENOblock. Panel d shows western blots for recombinant proteins blotted with ENO 1, ENO2 and pan-ENO antibodies.

