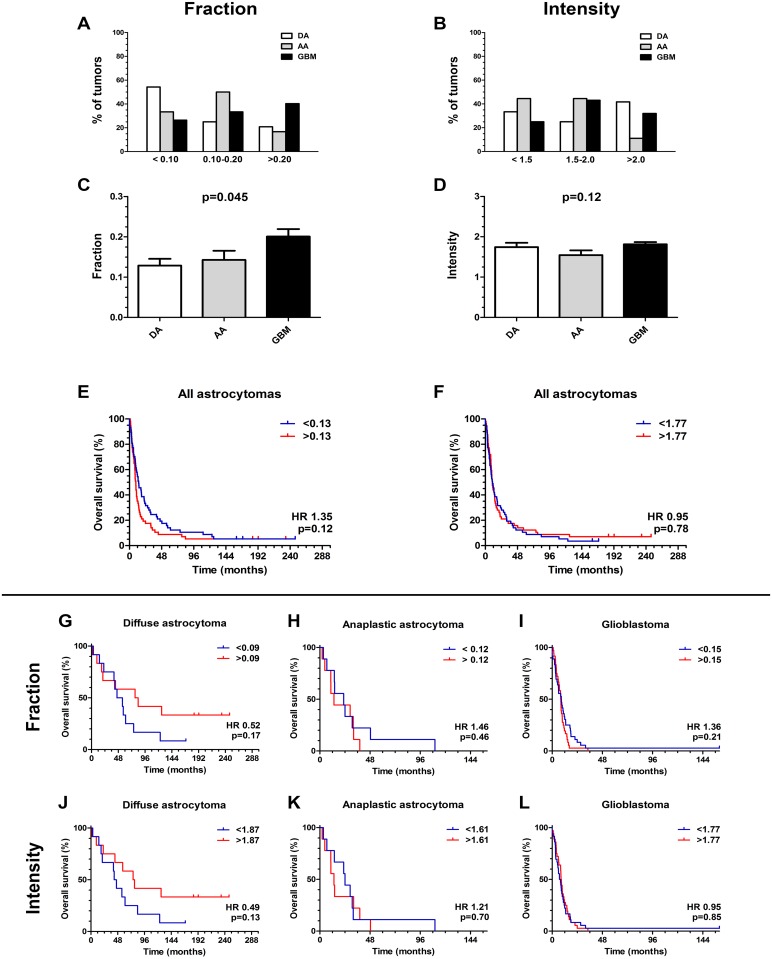
Fig 3. Distribution of Oct-4 staining and Kaplan Meier Survival analysis.
For tumor cell fraction, glioblastomas were the most frequent tumors in the high expression group (>20%), whereas anaplastic astrocytomas were the most frequent tumors in the group with median expression level (10–20%). (A) Over 50% of diffuse astrocytomas was located in the low expression group (0–10%), where also the lowest percentage of glioblastomas was located. (B) For tumor cell staining intensity no clear pattern of distribution was found. (C) Comparing Oct-4 expression with grade there was a significant association of Oct-4 fraction with grade (p = 0.045), (D) whereas the Oct-4 intensity was similar for the individual grades (p = 0.12). (E-L) Kaplan-Meier plots for all astrocytomas showed no statistically significant association of Oct-4 (E) fraction and (F) intensity with overall survival. (G, J) For diffuse astrocytomas, (H, K) anaplastic astrocytomas and (I, L) glioblastomas no statistically significant association between Oct-4 fraction/intensity and overall survival was found. For comparison of grades, data are shown as means +SEM and ANOVA with Bonferroni correction was used for comparison of the different tumor grades.

