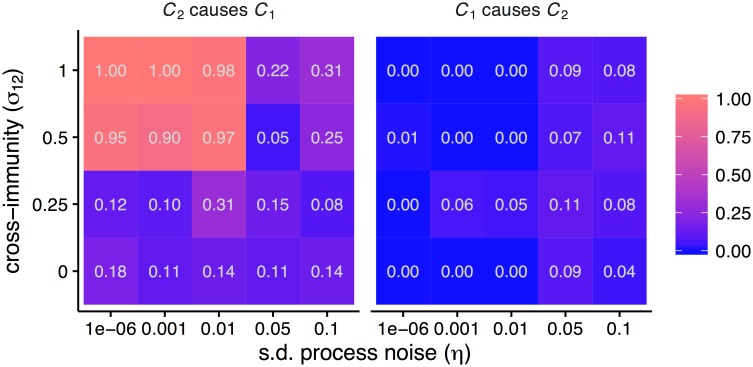
Fig 4. Interactions detected as a function of process noise and the strength of interaction (C2 → C1) and representative time series.
Heat maps show the fraction of 100 replicates significant for each inferred interaction for different parameter combinations. A maximum, positive cross-map correlation ρ at a negative lag indicated a causal interaction. Each replicate used 100 years of monthly incidence.

