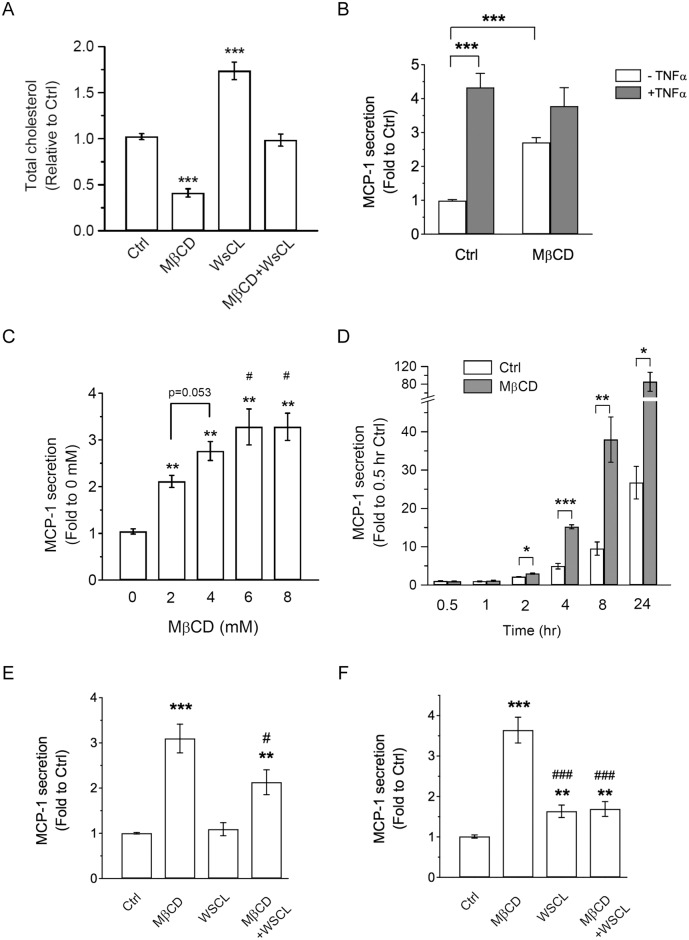
Fig 1. MβCD treatment increases MCP-1 secretion in 3T3-L1 adipocytes.
(A) 3T3-L1 adipocytes were untreated (Ctrl) or treated with 4 mM MβCD, 250 μg/ml WSCL, or both for 4 h. Cellular lysate was collected and cholesterol levels were determined. (B) 3T3-L1 adipocytes were untreated (Ctrl) or treated with 4 mM MβCD, together without or with 1 ng/ml TNFα for 4 h. MCP-1 secretion in the media was determined. Each point represents the mean ± S.E. of three independent experiments. Asterisks denote significant differences (***p<0.001). (C) 3T3-L1 adipocytes were treated with increasing MβCD doses (0, 2, 4, 6, 8 mM) for 4 h. MCP-1 secretion was determined. Each point represents the mean ± S.E. of three independent experiments. **p<0.01, compared with 0 mM MβCD treatment. #p<0.05, compared with 2 mM MβCD treatment. (D) 3T3-L1 adipocytes were untreated (Ctrl) or treated with 4 mM MβCD for different time points (0.5, 1, 2, 4, 8, or 24 h). MCP-1 secretion was determined. Each point represents the mean ± S.E. of three independent experiments. Asterisks denote significant differences (*p<0.05, **p<0.01, ***p<0.001). (E) 3T3-L1 adipocytes were untreated (Ctrl) or treated with 4 mM MβCD, 250 μg/ml WSCL, or both for 4 h. MCP-1 secretion in the media was determined. Each point represents the mean ± S.E. of eight independent experiments. **p<0.01, ***p<0.001, compared with Ctrl. #p<0.05, compared with MβCD treatment. (F) 3T3-L1 adipocytes were untreated (Ctrl) or treated with 4 mM MβCD, 250 μg/ml WSCL, or both for 24 h. MCP-1 secretion in the media was determined. Each point represents the mean ± S.E. of six independent experiments. **p<0.01, ***p<0.001, compared with Ctrl. ###p<0.001, compared with MβCD treatment.

