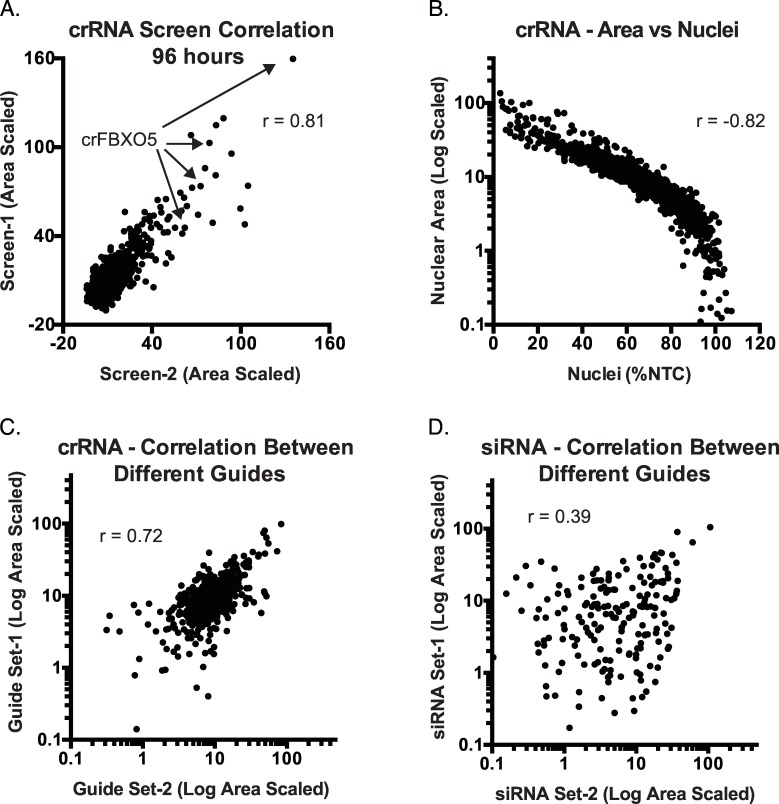
Fig 4. Various relationships among crRNA and siRNA screen data.
(A) Biological replicates of a synthetic CRISPR screening experiment. Each dot indicates the value derived from a single crRNA assayed in separate experiments. (B) Increased nuclear area exhibits a strong negative correlation with nuclear count. Points correspond to values from individual wells. (C-D). Comparison of the effect of different guides (C) or siRNA (D) targeting the same gene on measured nuclear area. “Sets” are the average activity of randomly selected pairs of guides or siRNAs targeting the same gene. There are two pairs per gene given that each gene has 4 corresponding crRNA or siRNA reagents. The correlation between any randomly selected single crRNA targeting the same gene was also greater than that for siRNA (r = 0.45 versus r = 0.18; S4 Fig).

