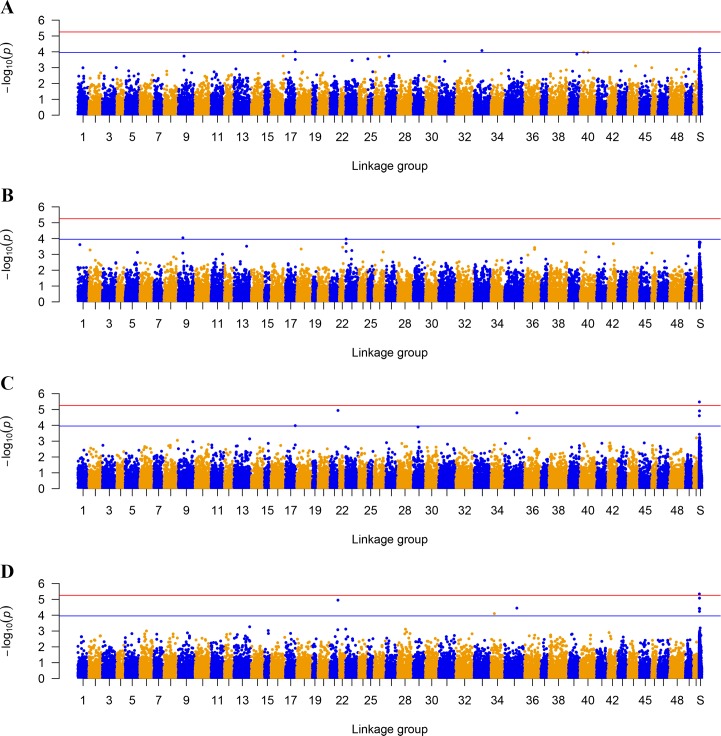
Fig 1. Manhattan plots of genome-wide association results.
The red and blue solid line indicates the threshold P-value for genome-wide significant (5.56E-06) and suggestive (1.11E-04) level, respectively. Abbreviations: S, scaffold; A, fat content in dorsal muscle (MFdo); B, fat content in abdominal muscle (MFab); C, abdominal fat weight (AbFW); D, percentage of AbFW to eviscerated weight (AbFP).

