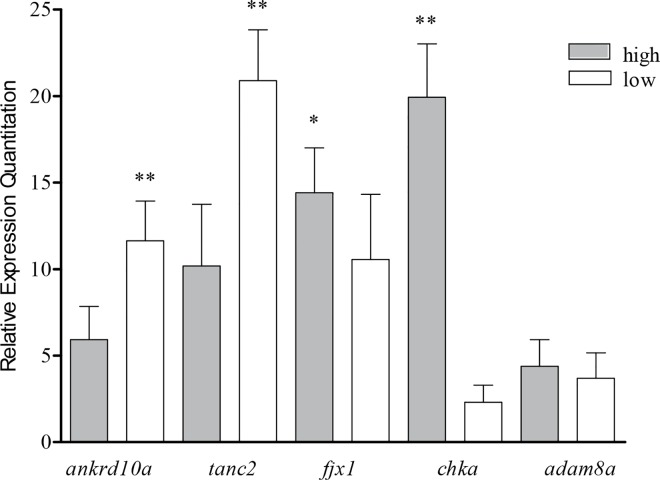
Fig 2. Relative mRNA abundance in the high and low dorsal muscle fat content groups.
Relative expression levels were obtained by the 2-ΔΔCT method; 18S was used as normalizing controls. High group (n = 10) consisting of samples from common carp with the highest trait values and Low group (n = 10) with the lowest trait values; *, P < 0.05; ** P < 0.001.

