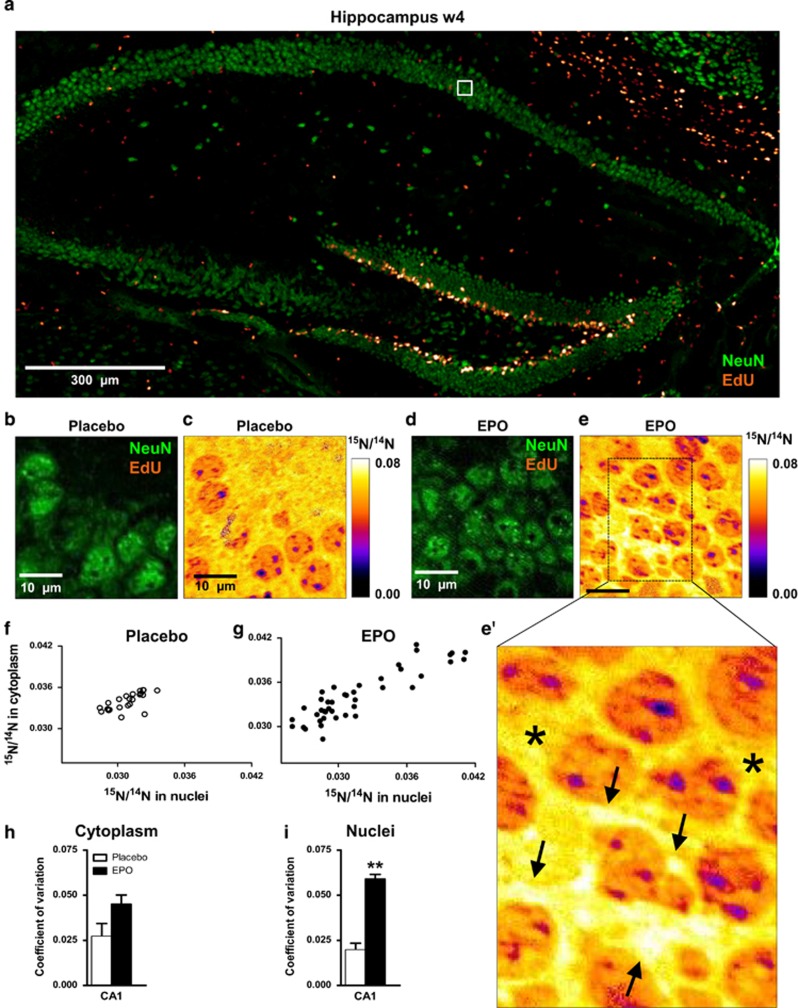
Figure 3.
15N-leucine incorporation in CA1 pyramidal neurons evaluated by nanoscopic secondary ion mass spectrometry (NanoSIMS). (a) Overview of the hippocampus showing dense proliferation signals (EdU) in the dentate gyrus. The white square illustrates the EdU signal-free area in the pyramidal layer, analyzed by NanoSIMS. (b and c) Illustration of samples following placebo treatment; (d, e and e') Illustration of samples following erythropoietin (EPO) treatment; arrows in e' point to newly generated neuronal cell mass with high15N/14N ratio; stars in e' denote ‘control' signal in cytoplasmic regions of older neurons. (f and g) Scatter plots of 15N/14N ratios in pyramidal neurons in both treatment groups. (h and i) Coefficient of variation of 15N/14N ratios in cytoplasm and nuclei of pyramidal neurons (n=3 for both groups). All bar graphs are shown as mean±s.e.m.; **P<0.01 (unpaired two-tailed t-test).

