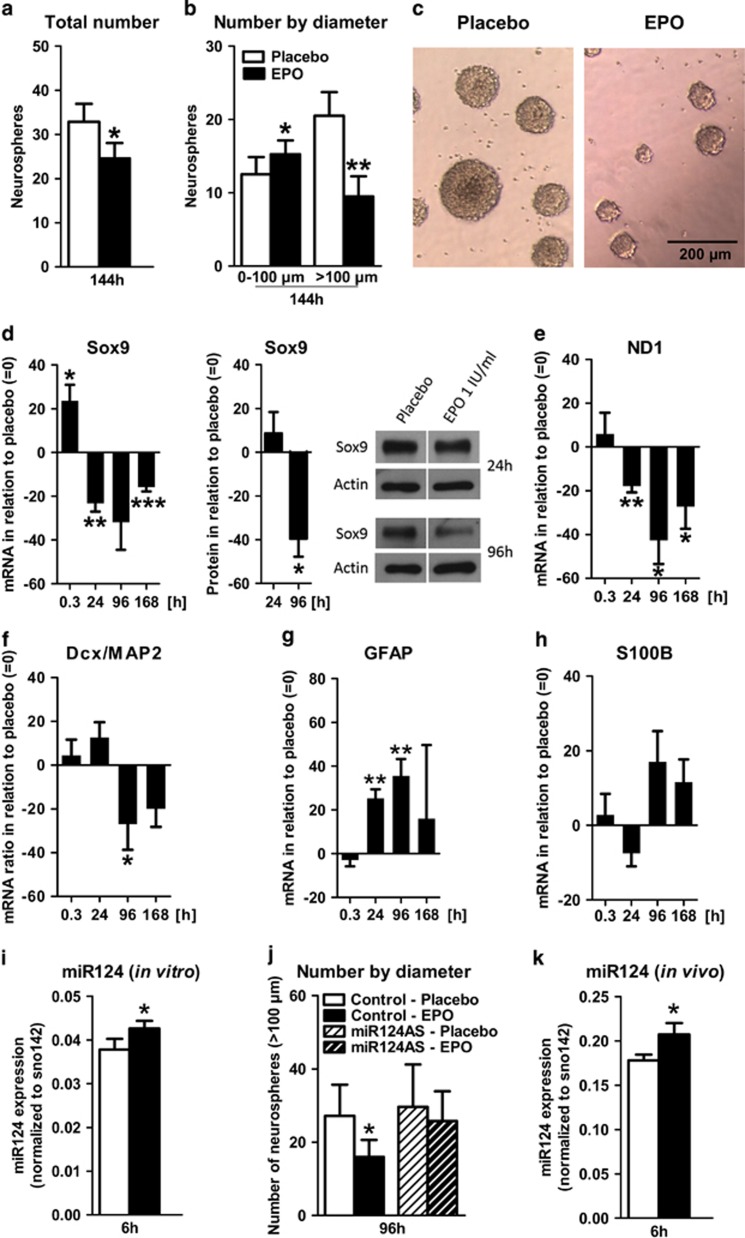
Figure 5.
Erythropoietin (EPO) effects on proliferation and differentiation of E14 forebrain neurospheres and role of miR124; (a-c) Quaternary E14 forebrain neurospheres cultured under proliferating conditions: histogram showing total number (a) and number by diameter (n=4 per group, paired two-tailed t-test) (b) of quaternary neurospheres at 144 h after EPO/placebo (n=4 per group, paired two-tailed t-test). (c) Phase contrast image of neurospheres. (d-j) Quaternary E14 forebrain neurospheres cultured under differentiating conditions: (d-h) qPCR/western blot results of differentiation markers. EPO-induced changes are expressed as % difference from placebo at the respective time point. Compare Supplementary Table 3. (d) Early neural marker Sox9, shown at mRNA level (0.3 h: n=5, 24 h: n=5, 96 h: n=5, 168 h: n=6, paired two-tailed t-test per time point), as well as protein level (n=3 per group, paired two-tailed t-test per time point) together with a sample western blot. (e) Early neural marker ND1 (0.3 h: n=6, 24 h: n=6, 96 h: n=5, 168 h: n=6, paired two-tailed t-test per time point). (f) Dcx/MAP2 ratio (0.3 h: n=6, 24 h: n=10, 96 h: n=9, 168 h: n=6, paired two-tailed t-test per time point). (g and h) GFAP (0.3 h: n=7, 24 h: n=7, 96 h: n=6, 168 h: n=7, paired two-tailed t-test per time point) and S100B (0.3 h: n=6, 24 h: n=11, 96 h: n=9, 168h: n=6, paired two-tailed t-test per time point). (i and j) miR124 expression and consequence of miR124 knockdown in proliferating neurospheres: (i) miR124 expression in proliferating neurospheres at 6h after addition of EPO/placebo (n=8 per group, paired two-tailed t-test). (j) Neurospheres with diameter >100 μm at 96h after addition of EPO/placebo to neurospheres transfected with miR124 antisense (AS) or scrambled sense (control) oligos (n=4 per group, paired one-tailed t-test). (k) miR124 expression in hippocampus of 28 day-old mice 6h after treatment with EPO/placebo (n=8 per group, unpaired one-tailed t-test). All n-numbers given for the in vitro data are derived from biological replicates, that is, independent cell preparations. All bar graphs are shown as mean±s.e.m.; *P<0.05, **P<0.01, ***P<0.001.

