Figure 6.
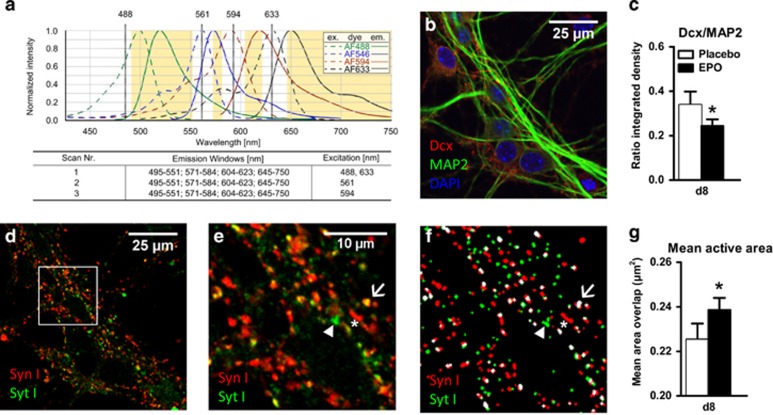
Effects of erythropoietin (EPO) on neuronal differentiation and maturation, determined by mean active area of synapses in E17-HCC. Neurons (d8) were quadruply stained for differentiation markers Dcx and MAP2 and activity markers Synaptotagmin I (SytI) and Synapsin I (SynI) (n=8). Staining was analyzed by confocal microscopy. (a) The protocol includes three sequential scans with fixed emission windows (orange) with different excitation wave length. Excitation (dashed line) and emission (solid line) spectra are shown for each fluorescent dye, Alexa Fluor 488 (MAP2, green), Alexa Fluor 546 (SynI, blue), Alexa Fluor 594 (SytI, red) and Alexa Fluor 633 (Dcx, black). 4,6-Diamidino-2-phenylindole (DAPI) fluorescence was determined using an additional excitation at 406 nm. (b) Unmixed confocal picture showing differentiation markers Dcx (red), MAP2 (green) and DAPI (blue). (c) Quantification of the integrated density of Dcx and MAP2 presented as ratio (n=8 per group, paired one-tailed t-test). (d) Unmixed confocal picture showing SytI (green) and SynI (red). (e) Higher magnification of the square mark of picture d, showing single stained dots for SytI (green, arrowhead), single stained dots for SynI (red, star) and colocalized dots (yellow, arrow). (f) Masked images for analyzing the number and area of SytI (green, arrowhead), SynI (red, star) and colocalized (white, arrow) dots. (g) Quantification of the mean overlapping (colocalized) area as mean active area (white spots in f, n=8 per group, paired two-tailed t-test). All n-numbers given are derived from biological replicates, that is, independent cell preparations. All bar graphs are shown as mean±s.e.m.; *P<0.05.

