. 2016 Dec 22;16(6):344–357. doi: 10.4110/in.2016.16.6.344

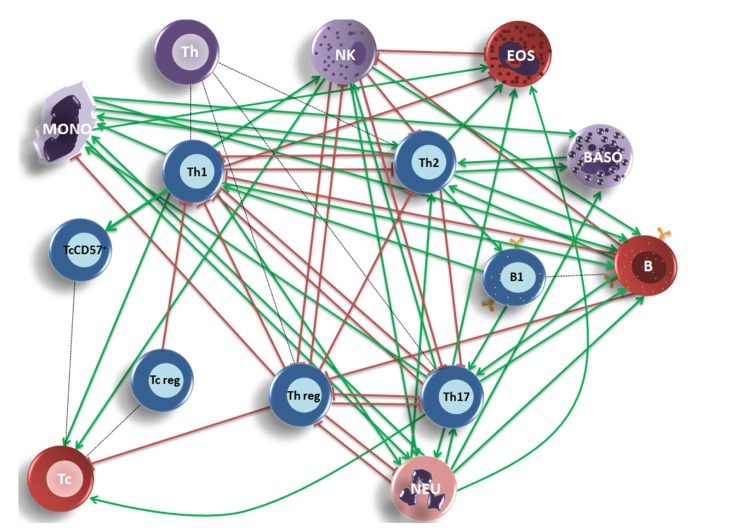
Figure 4. A systems medicine view of the regulatory lymphocyte subpopulations panel. Activatory (A, green arrows) and Inhibitory (I, red lines) relationships between circulating cells were identified according to cellular or cytokinergic interactions previously described. In some cases different states of the same cell type produce conflicting stimuli and the relative relationship was thus not assigned in the figure. Th1 lymphocytes - A: Tc, Tc-CD57+, NK, MONO, NEUT; I: Th2, Th17, EOS (69,70,71,72,73,74,75,76,77,78,79,80,81,82). Th2 lymphocytes – A: B lymphocytes, B1 lymphocytes, EOS, BASO, MONO; I: Th1, Th17 (77,78,79,83,84,85,86,87,88). Th17 lymphocytes - A: Tc, B lymphocytes, NK, MONO, NEUT, EOS; I: Th1, Th-reg (73,89,90,91,92,93,94,95,96,109). Th-reg lymphocytes - I: Th1, Th2, Th17, Tc, NK, MONO, NEUT (56,83,88,92,97,98,99,100,101,102). B lymphocytes - A: Th2, Th17; I: Th1, Th-reg, NK (103,104,105,106). B1 lymphocytes - A: Th1, Th17 (107,108). Tc-reg lymphocytes - I: Th1(42). NK cells - A: Tc, B cells, NEUT; I: Th2, Th-reg, EOS (76,78,86,89,93,95,110). MONO - A: Th2, B cells, BASO, NEUT, EOS (77,106,111,112). NEUT - A: Th2, Th17, B cells, MONO, EOS, BASO; I:Th-reg (77,78,93,94,113). Artwork was created with Microsoft Office PowerPoint 2007, standard blood cell cartoon symbolic representation was used.

Figure 4