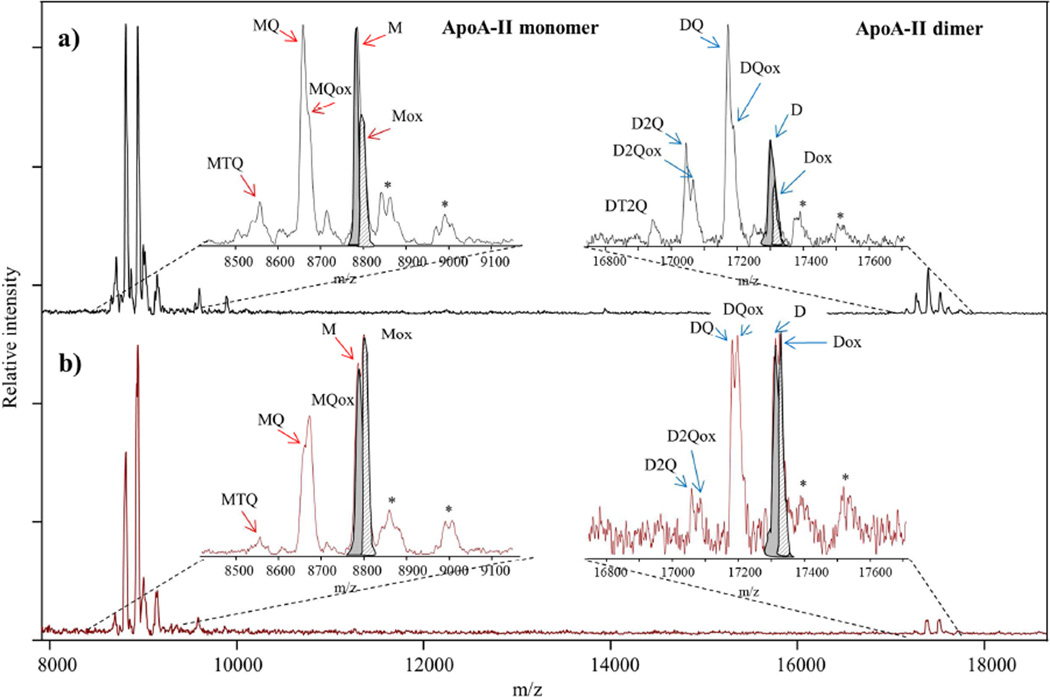
Figure 1. Example of MALDI TOF Mass Spectra of apoA-II proteoforms obtained with MSIA from: a) non-diabetic and b) diabetic human plasma sample.
Using MSIA, we detected signals for the native monomer and dimer of apoA-II, along with several apoA-II proteoforms in plasma. Monomer apoA-II (M) represents cysteinylation on C in position 6 and cyclization on N-terminal Q residue. Truncated TQ monomer (MTQ) represents the monomer apoA-II lacking the C-terminal TQ dipeptide. The truncated Q monomer (MQ) is monomeric apoA-II missing the C-terminal Q residue. The dimer (D) comprises 2 monomers linked by a disulfide bond. The truncated Q dimer (DQ) is an apoA-II dimer missing the Q residue on only one monomer. The truncated 2Qs dimer (D2Q) represents the Dimer apoA-II lacking 2 × C-terminal Q residues on both monomers. Ox refers to the corresponding oxidized proteoforms (signals in the mass spectra are detected at a mass shift of +16). The most abundant proteoforms in our samples were M and Mox. Signals labeled with (*) in the mass spectra correspond to the matrix adducts. Note that for apoA-II M and D proteoforms in both mass spectra, native vs oxidation peaks are highlighted in grey (M and D) and in grey stripes (Mox and Dox). Because of the peak overlap, integration was done using peak intensity as oppose to peak area. The relative percent abundance (RPA) of the oxidized proteoforms is calculated as percentage of the total apoA-II (sum of oxidized and non-oxidized proteoforms).
Sample mass spectra from control (Fig 1a) and diabetic (Fig 1b) subjects show the difference in oxidation ratios between the two groups. The relative abundance of ox proteoforms was greater in the mass spectra from the diabetic sample compared to the non-diabetic sample. MSIA: Mass Spectrometric Immunoassay.

