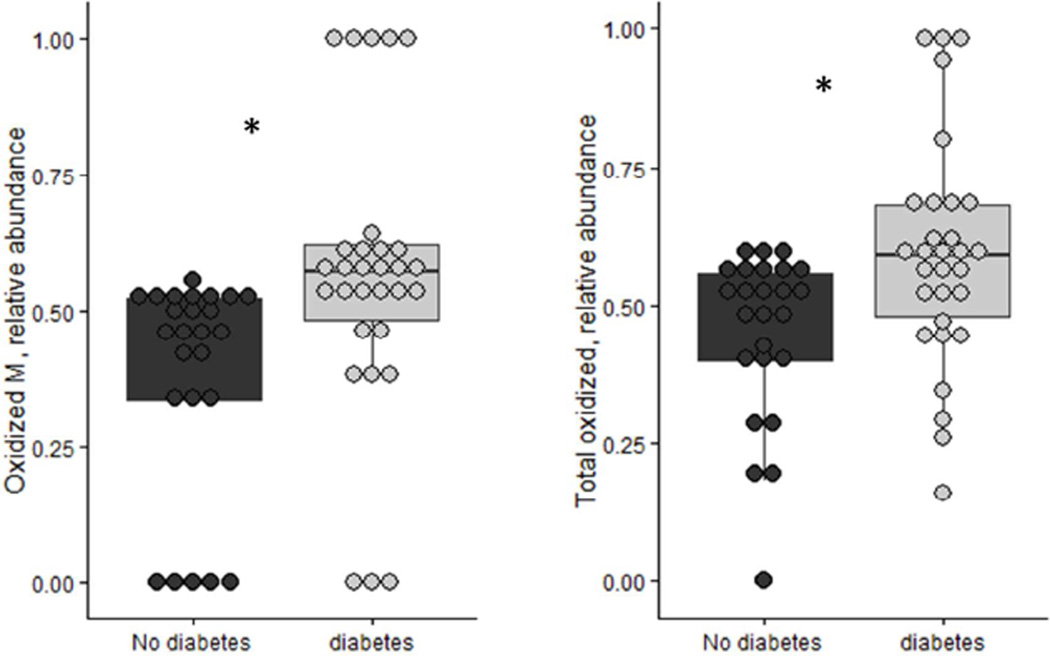
Figure 2. Distribution of the relative abundance of apoA-II oxidized monomer and total oxidized apoA-II in diabetes versus control samples.
The ratio of apoA-II Mox/M was significantly increased in participants with diabetes (n=30) compared to participants without diabetes (n=25). The differences persisted after adjusting for HDL cholesterol levels and BMI (p=0.003). The total oxidation ratio computed for all proteoforms was also higher in participants with diabetes (p=0.005) M: apoA-II monomer. Mox: apoA-II monomer oxidized (+16). *p<0.01

