
Figure 3.
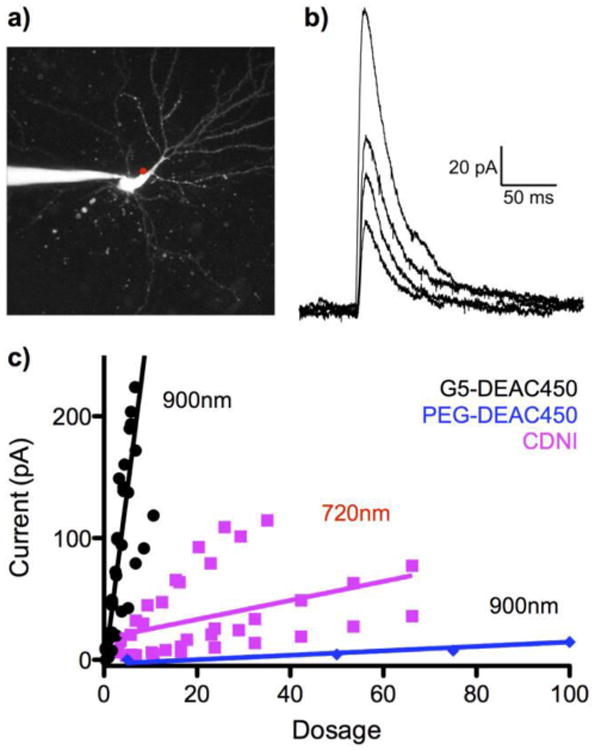
Comparative photolysis of G5-DEAC450-GABA and CDNI-GABA. a) Fluorescent image of a patch-clamped CA1 neuron with the position of uncaging represented by the red dot. The patch pipette can be seen exiting the image frame to the left. b) Representative series of currents evoked by uncaging G5-DEAC450-GABA at 900 nm using increasing power (26, 31, 42, and 53 mW, for cosmetic reasons stray electric noise has been filtered from these traces). c) Summary of power trains for G5-DEAC450 at 900 nm (n = 5, black), CDNI (n = 5, violet) and PEG-DEAC450 (n = 1, blue). “Dosage” = (power)2 × QY × conc. × time/wavelength × pulse width.