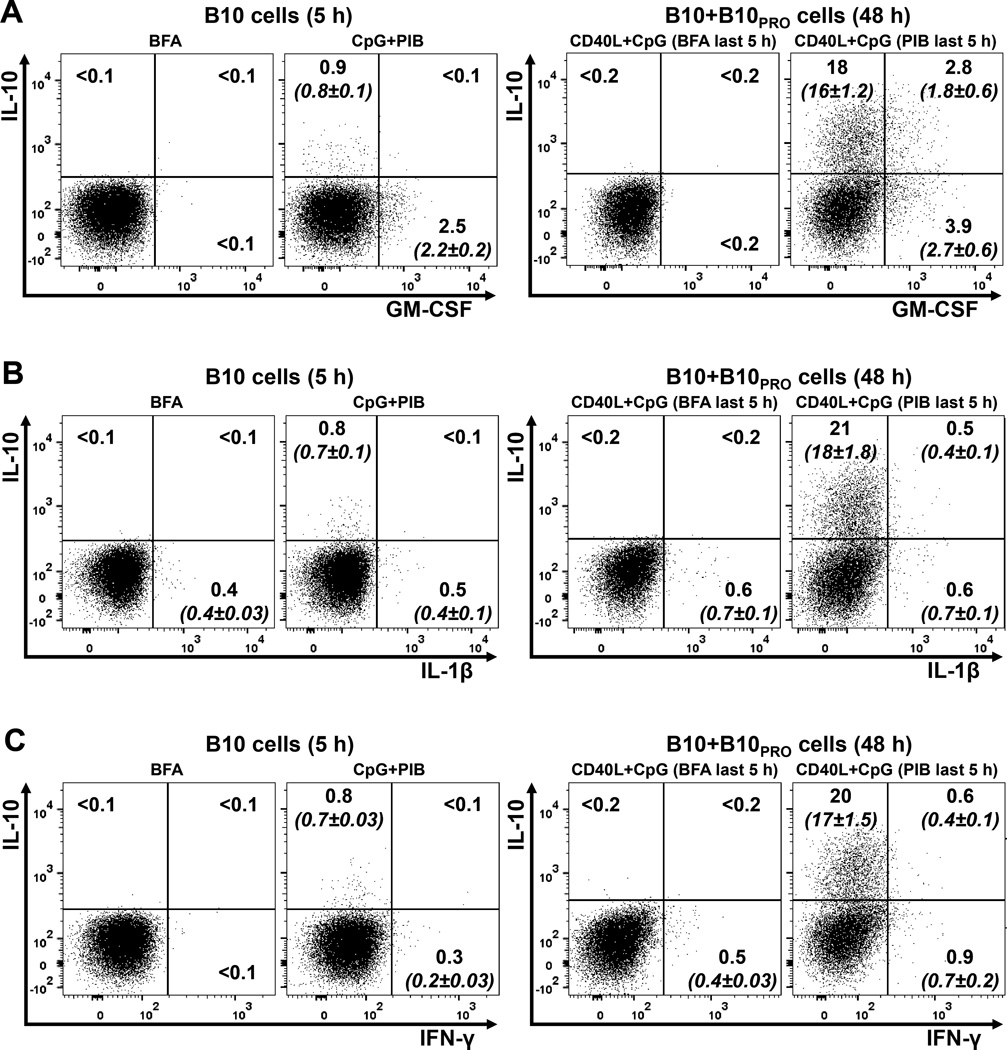
Figure 3.
Relationship between IL-10-producing and proinflammatory cytokine-producing B cells. B cells purified from a healthy 12-year-old child (HC17, Supplementary Table 1) were cultured with CpG for 5 hours (B10 cells) or CD40L+CpG for 48 hours (B10+B10PRO cells), with BFA or PIB added to the cultures during the last 5 hours. B cells were stained intracellularly for IL-10 and either GM-CSF (A), IL-1β (B) or IFN-γ (C). The position of all gates was determined using isotype-matched control mAb staining and fluorescence minus one (FMO) controls. These data are representative of those obtained in three separate experiments (n=3; HC3, HC7 and HC17 in Supplementary Table 1). All flow cytometry dot plots were gated on CD19+ live lymphocytes, with numbers representing their frequencies (% of total) within each gate; mean (±SEM; n=3) values are shown within parentheses in italics.

