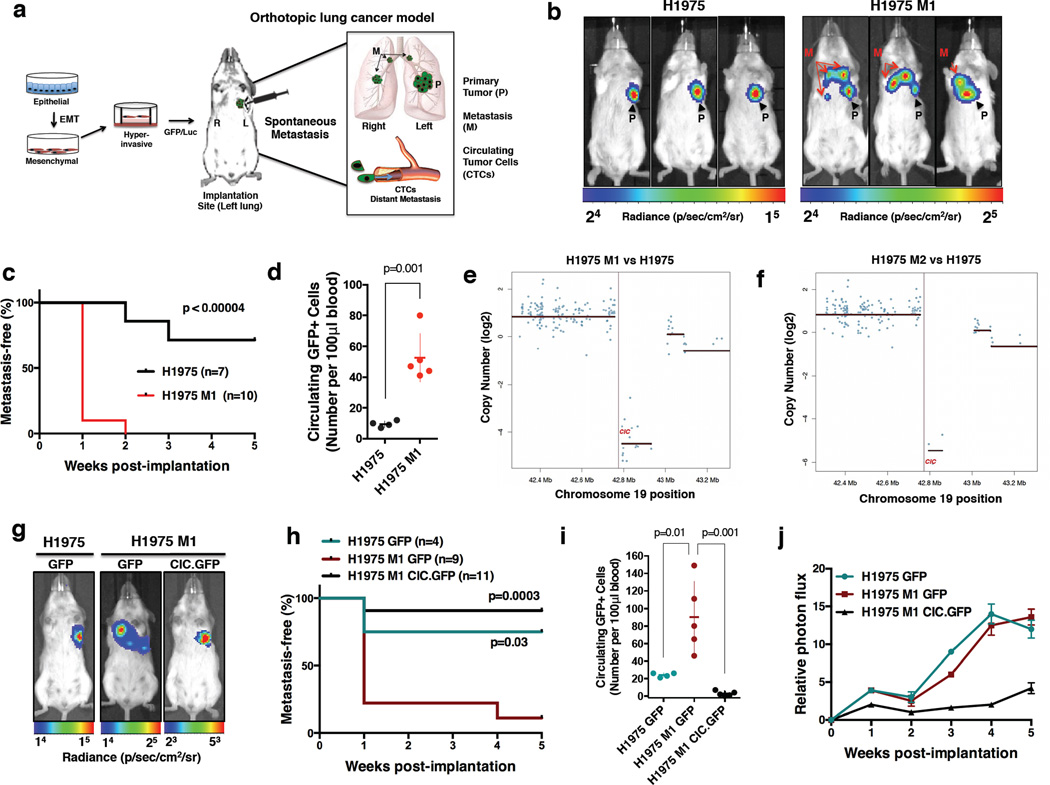
Figure 1. In vivo orthotopic model identifies novel effectors of lung cancer metastasis.
(a) Orthotopic in vivo metastasis platform. (b) Bioluminescent images (BLI) of mice bearing H1975 GFP-Luc or H1975 M1 GFP-Luc cells. Left lung = implantation site; P = primary tumor; M = metastasis. (c) Metastasis-free survival comparing H1975 (n=7) and H1975 M1 (n=10) mice. p-value, log-rank. (d) Number of circulating GFP+ cells per 100 µl at 5 weeks post-implantation. Mean +/− SEM, 10 +/− 2 (H1975) and 52 +/− 7 (H1975 M1). p-values, Student’s t-test. (e-f) Whole exome copy number profile at the CIC locus in H1975 M1 (e) and M2 (f) cells, compared to H1975 parental cells. (g) BLI of mice bearing H1975 GFP-Luc and H1975 M1 GFP-Luc expressing cells with either GFP control or GFP-CIC. Left lung = implantation site. (h) Metastasis-free KM curve comparing H1975 mice (n = 4) to H1975 M1 mice expressing GFP control (n = 9) or GFP-CIC (n = 11). p values, log-rank test. (i) Number of circulating GFP+ cells per 100 µl of blood at 5 weeks post-implantation. Mean +/− SEM, 24 +/− 1.2 (H1975 GFP), 90 +/− 18 (H1975 M1 GFP), and 3 +/− 1.2 (H1975 M1 CIC.GFP). p values, one-way ANOVA. (j) Normalized mean photon flux of H1975 GFP-luc or H1975 M1 mice expressing either GFP control or CIC.GFP over 5 weeks (from mice in g, h). Error bars reflect SEM.

