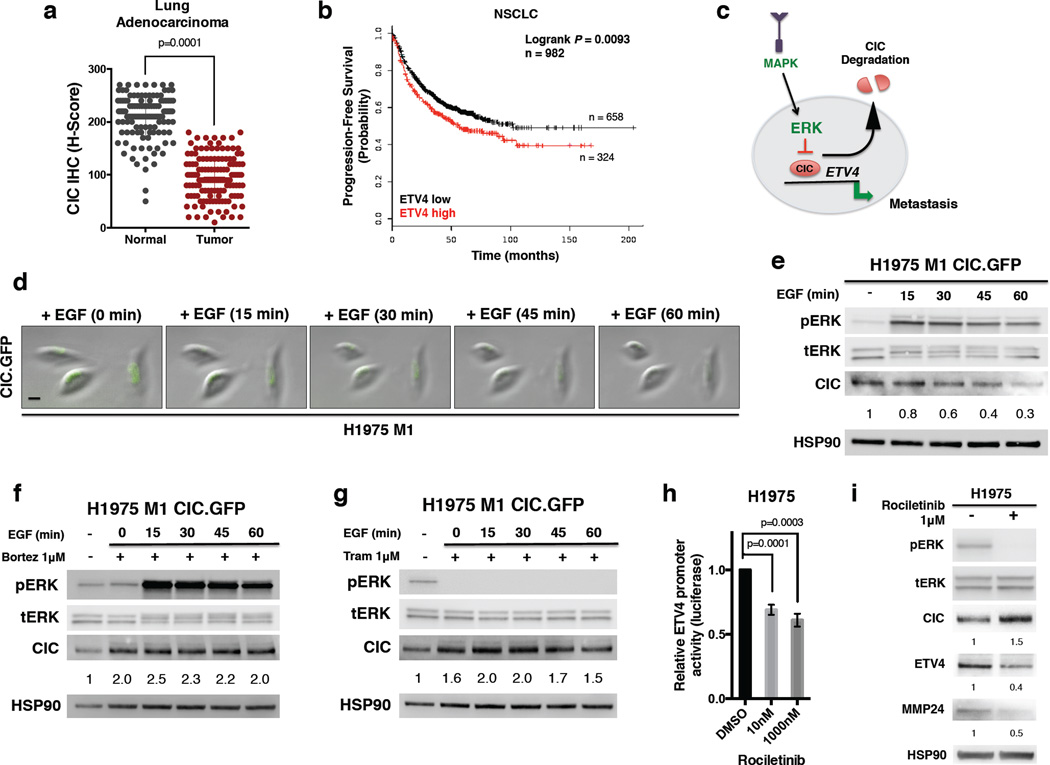
Figure 5. MAPK pathway activation functionally suppresses CIC.
(a) Nuclear CIC expression (H-score) in 130 LA cases and 126 normal adjacent lung tissue specimens. Mean +/− SEM, 207 +/− 4.0 (normal) and 94 +/− 3.5 (tumor). p-values, Student’s t-test. (b) PFS KM curve for lung cancer patients with either ETV4 high or ETV4 low mRNA expression. n = 982, p = 0.0093. Probe 211603_s_at. (c) Model of MAPK-ERK mediated functional suppression of CIC. (d) Time-lapse microscopy images of serum starved, EGF stimulated H1975 M1 cells expressing GFP-tagged CIC over the indicated intervals. Experiments were performed in duplicate with all CIC.GFP expressing cells (15/15) showing decreased nuclear GFP expression following EGF stimulation. Scale bar, 20 µm. Data show representative cells from two independent experiments. (e) Immunoblot time-course of EGF stimulated H1975 M1 cells expressing GFP-tagged CIC. Representative of two independent experiments. (f) Immunoblot time-course of EGF-stimulated H1975 M1 cells expressing GFP-tagged CIC, pretreated with bortezomib for 6 hours. Representative of two independent experiments. (g) Immunoblot time-course of EGF-stimulated H1975 M1 cells expressing GFP-tagged CIC, pretreated with trametinib for 6 hours. Representative of two independent experiments. (h) Relative ETV4 luciferase promoter activity in H1975 cells with DMSO or rociletinib treatment. p-values, one-way ANOVA. Error bars represent SEM, n=5. (i) Immunoblots of H1975 cells treated with DMSO (−) or rociletinib (+) for 16 hours. Representative of two independent experiments.

