
Figure 1. The subcellular localization of MSL1 in Arabidopsis.
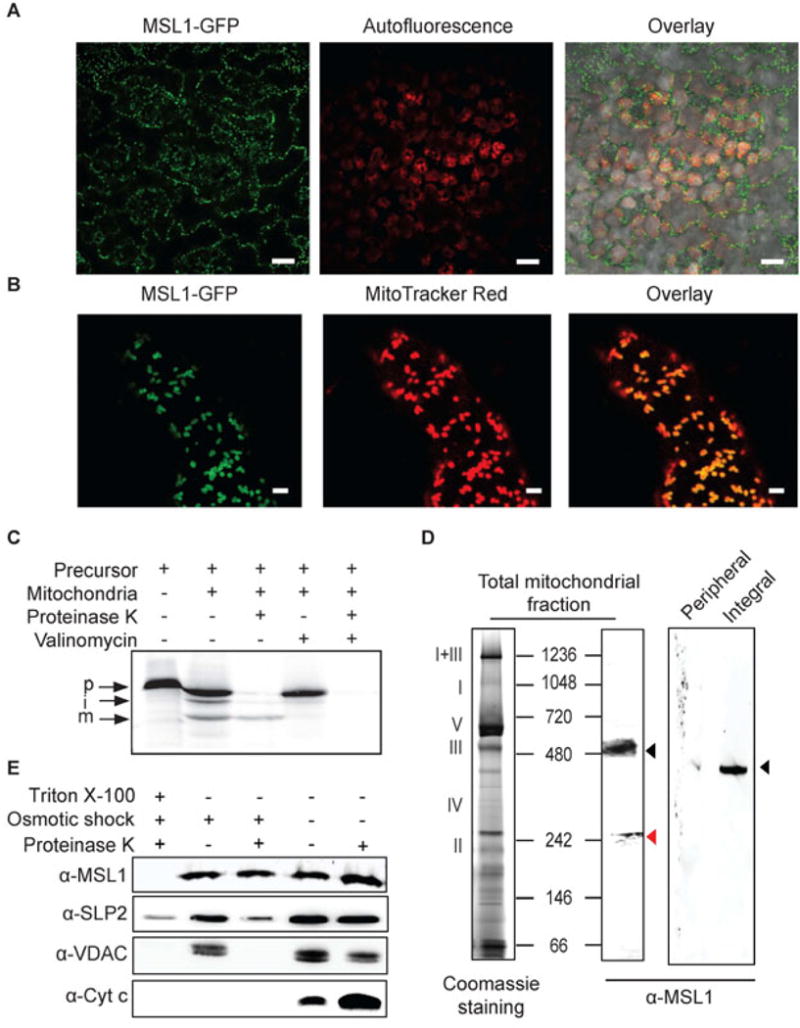
(A) CLSM image of mesophyll cells from transgenic plants stably over-expressing MSL1-GFP. GFP signal is pseudocolored green and chlorophyll fluorescence is pseudocolored red. Scale bar = 20 μm (B) CLSM image of a root hair from a plant stably over-expressing MSL1-GFP after incubation with MitoTracker Red. GFP signal is pseudocolored green and MitoTracker red is pseudocolored red. Scale bar = 2 μm (C) Immunoblotting of isolated mitochondria and mitochondrial peripheral and integral membrane fractions following sodium carbonate treatment. Proteins were separated on a blue-native PAGE and immunoblots were probed using a peptide antibody raised against MSL1. Roman numerals correspond to the locations of respiratory complexes and ATP synthase complex on a typical 1D-blue-native PAGE of Arabidopsis mitochondria. (D) In vitro import of radiolabelled MSL1 into isolated mitochondria. Import reaction was carried out under conditions that support protein uptake into mitochondria. p, precursor protein; i, processed intermediate; m, processed mature protein. (E) Sub-mitochondrial location of MSL1. Isolated mitochondria were treated with (+) or without (-) osmotic shock to produce mitoplasts, proteinase K to digest exposed peptides and triton (TX-100) to solubilize all membranes. Immunoblotting was then carried out using antibodies raised against MSL1, stomatin 2 (SLP2, inner membrane), voltage-dependent anion channel (VDAC, outer membrane) and cytochrome c (cyt c, intermembrane space).