
Figure 4. Effect of the loss of MSL1 on membrane potential of isolated mitochondria in different respiratory states.
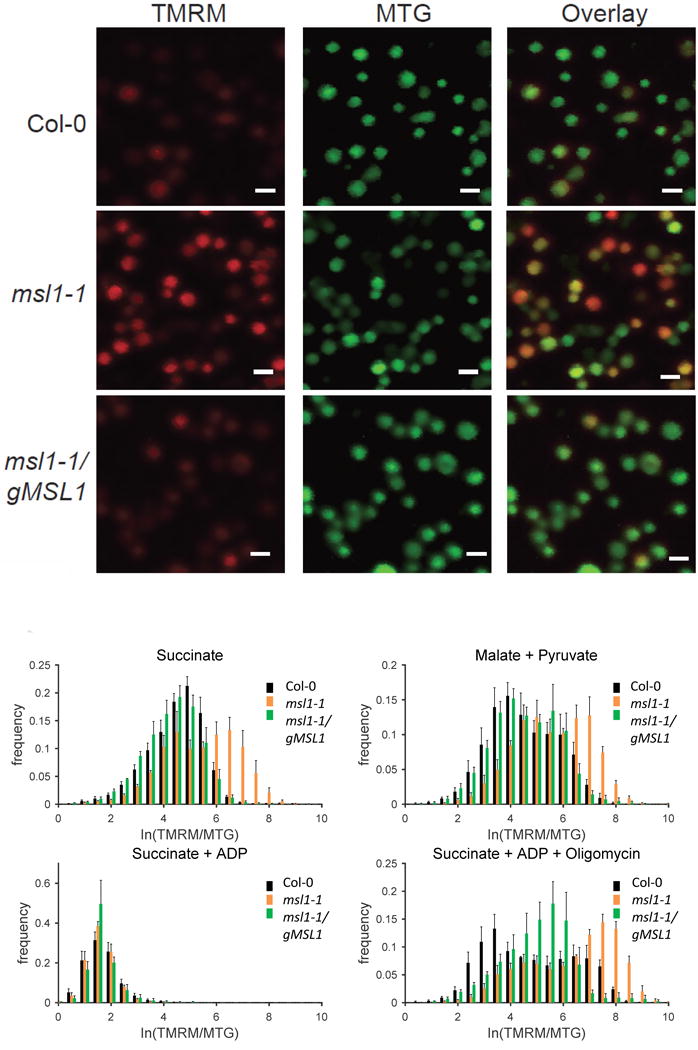
(A) Representative confocal image of isolated mitochondria from Col-0, msl1 and complemented line (msl1/gMSL1) incubated with minimal respiration buffer containing succinate to induce state II respiration and loaded with fluorophores TMRM and MTG. TMRM is false-colored red and MTG is false-colored green. Scale bar = 1 μm. (B-E) Frequency distribution of ΔΨm (expressed as the ratio between log-transformed intensity of TMRM and MTG) of isolated mitochondria in the presence of: (B) succinate (state II respiration); (C) malate and pyruvate (state II respiration); (D) succinate and 0.5 mM ADP (state III respiration); (E) succinate, 0.5 mM ADP and 1 μM oligomycin; MitoTEMPOLData shown are the average of at least four different experiments, with at least 500 mitochondria analysed per experiment, and error bars denotes standard error of the mean. Asterisk on each panel label indicates significant difference (p < 0.01 according to ANOVA and Tukey’s post-hoc analysis) between Col-0 vs msl1-1 and msl1-1 vs msl1-1/gMSL1 (complemented line) in the mean of TMRM:MTG fluorescence ratio from at least four independent experiments.