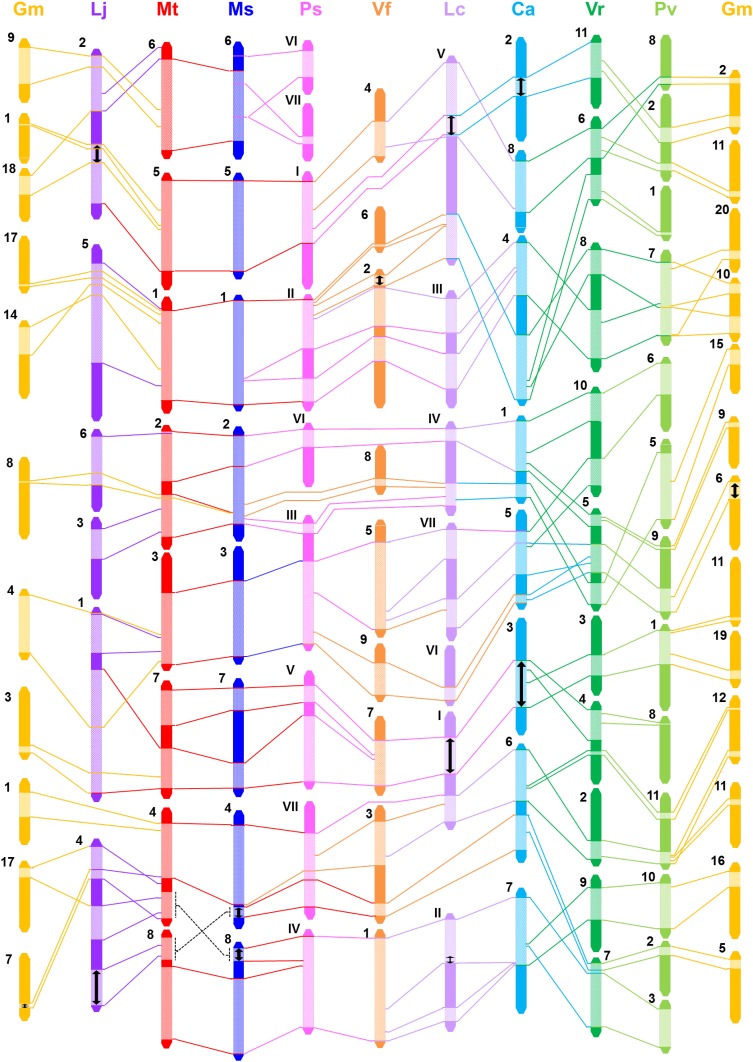
Fig. 3.
A simplified macrosyntenic relationships among ten legume species. Abbreviations for species names are the same as in Fig. 2. Sizes of chromosome/linkage group and synteny blocks are drawn to scale for each species, but not across species. Lines and arrows denote as follows: solid lines postulated rearrangement; double headed arrow postulated inversions

