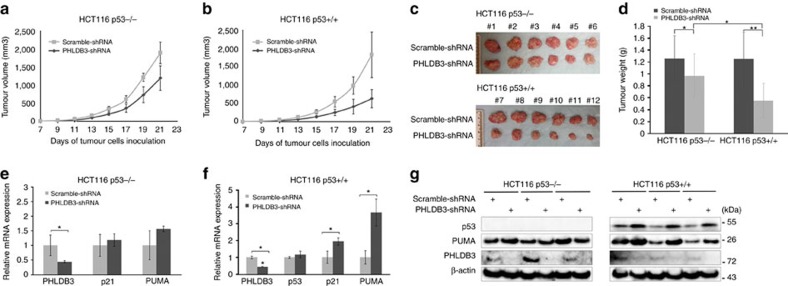
Figure 8. PHLDB3 knockdown inhibits tumour growth more significantly by inducing p53.
(a,b) Growth curves of xenograft tumours derived from HCT116p53+/+ or HCT116p53−/− cells that stably express PHLDB3 shRNA or scramble shRNA. Data are represented as mean±s.e.m. of mouse xenograft tumours (n=6). (c) The images of xenograft tumours collected at the end of the experiment as shown in a. (d) Graphs for the average weights (mean±s.e.m., n=6) of harvested xenograft tumours from the above experiments in panels (a–c). *P<0.05, **P<0.01 by two-tailed t-test. (e–g) The mRNA and protein levels of PHLDB3, p53 and p53 targets were assessed in randomly selected three tumour samples by RT-qPCR (e and f) or immunoblotting analysis with indicated antibodies (g). Data in e and f are represented as mean±s.e.m. of three randomly selected xenograft tumours; *P<0.05. Data shown in g are representative of three individual immunoblotting analyses with antibodies as indicated.

