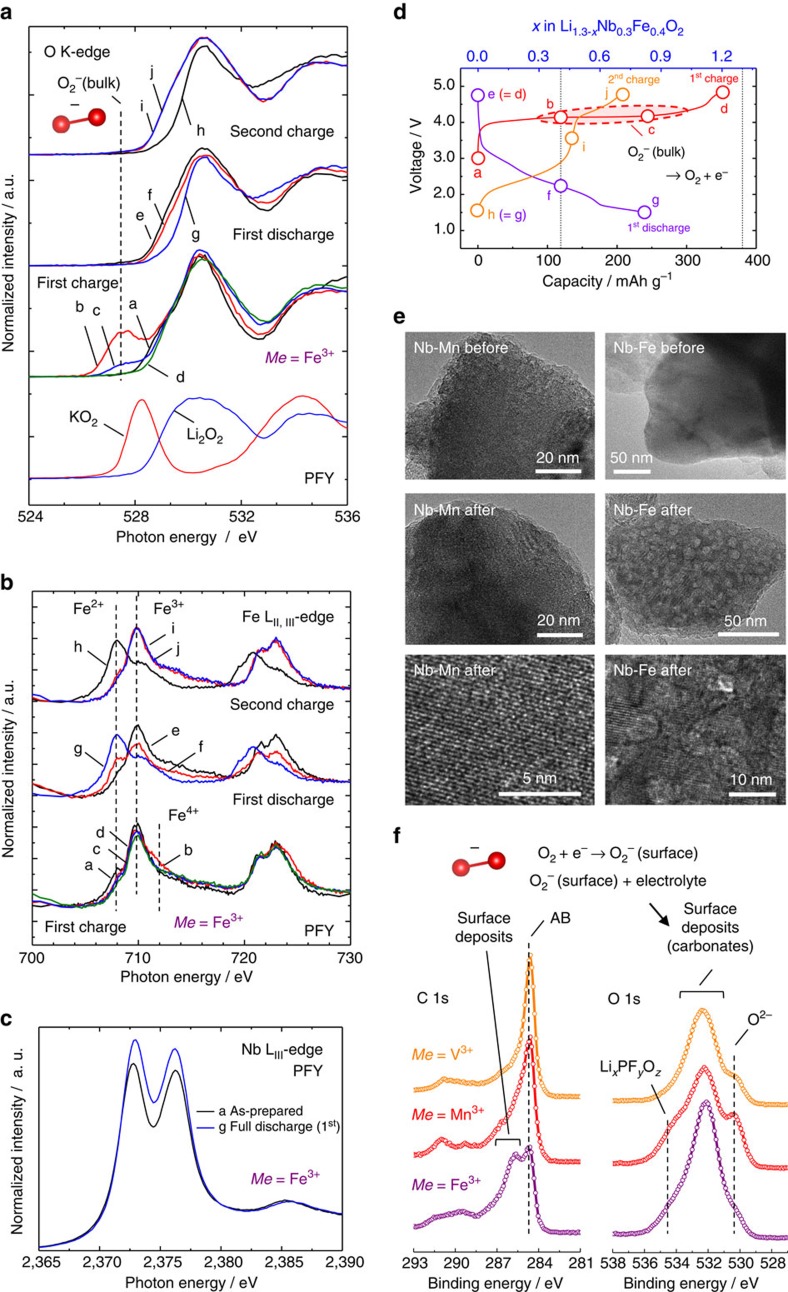
Figure 4. Changes in electronic structures for Li1.3−xNb0.3Fe0.4O2−δ on initial charge/discharge and second charge.
Changes in the O K-edge (a) Fe LII, III-edge XAS spectra (b), Nb LIII-edge XAS spectra (c), and the points where XAS spectra have been collected in (d). XAS spectra of KO2 (superoxide) and Li2O2 (peroxide) are also shown in (a) for comparison. Niobium is not responsible for charge compensation process (other data sets of Nb are shown in Supplementary Fig. 10). (e) TEM images of Li1.3Nb0.3Fe0.4O2 and Li1.3Nb0.3Mn0.4O2 particles before and after the electrochemical cycle at 50 °C. Oxygen loss for the Fe system results in the formation of nanosized grains in the single particle, and not for the Mn system. Lattice fringes are clearly observed after electrochemical cycle for the Mn system. (f) Surface structures observed by X-ray photoelectron (XPS) spectroscopy after discharge to 1.5 V. Oxygen molecules released on charge result in the electrochemical reduction on discharge, leading to the formation of surface deposits because of chemical reaction between active superoxide with electrolyte, as shown in our previous literature11.

