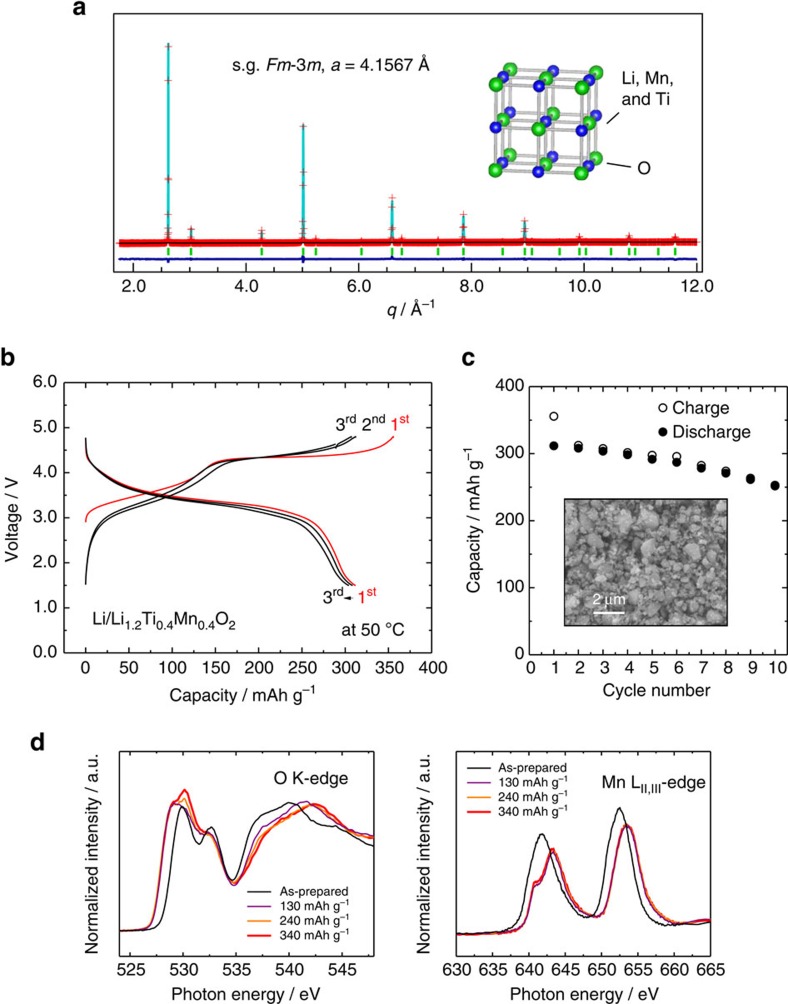
Figure 5. Li1.2Ti0.4Mn0.4O2 with a cation disordered rocksalt structure.
(a) Neutron diffraction pattern of the as-prepared sample; (b) charge/discharge curves in a Li cell at a rate of 5 mA g−1 at 50 °C; (c) discharge capacity retention and an SEM image of the ball-milled sample and (d) changes in O K-edge and Mn LII, III-edge XAS spectra on charge in Li cells. The samples used in (d) were prepared at 50 °C in Li cells.

