Figure 5.
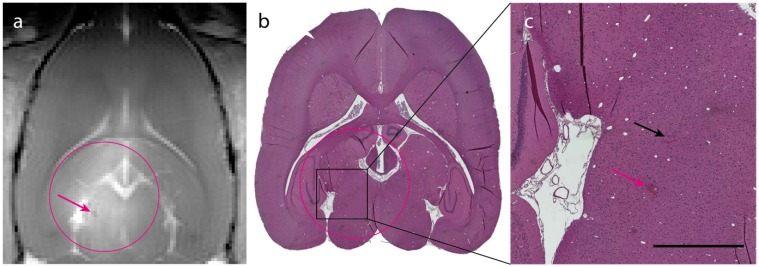
Histological analysis of ACT+A+E treatment. (a) T1-FLASH image showing BBB opening after treatment (magenta circle indicates treated area; magenta arrow indicates microhemorrhage). (b) HES stained image of the brain (magenta circle indicates treated area). (c) Magnified area of b showing two sites of extravasated erythrocytes (magenta arrow corresponds to the microhemorrhage in panel a, black arrow indicates small amount of extravasated erythrocytes; scale bar: 1 mm).

