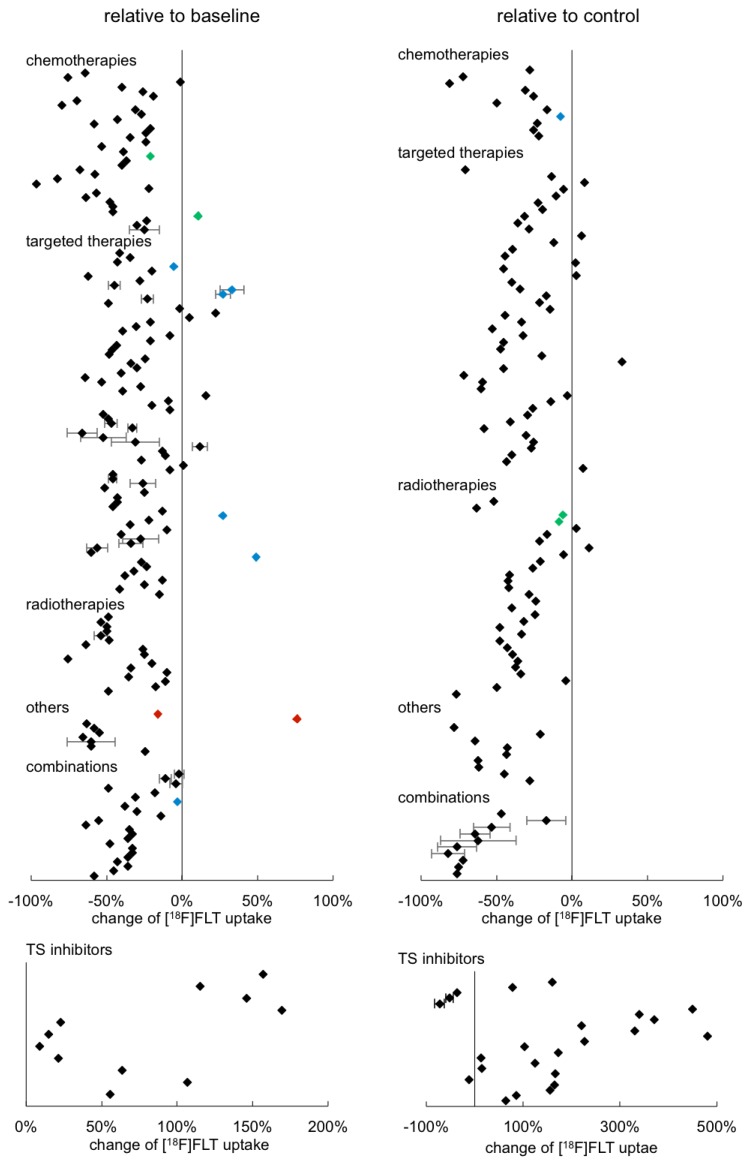
Fig 4.
Overview of the relative change of [18F]FLT after tumor therapy in preclinical in vivo models sorted according to therapy approach. Wherever possible, quantitative data were extracted from the publications and calculated as percent change either relative to baseline (left column) or to a respective control (right column). Each data point represents a single result of a study. The standard deviation could not be extracted from all publications. Rectangles represent results of a single analysis. Green rectangles represent data points of tumors that have regained their proliferative capacity at the end of a treatment cycle (as proven by immunohistochemistry). Blue rectangles represent data points of resistant tumors. Red rectangles represent results of tumors with very low baseline [18F]FLT uptake. Detailed results are displayed in Supplementary Table S2.

