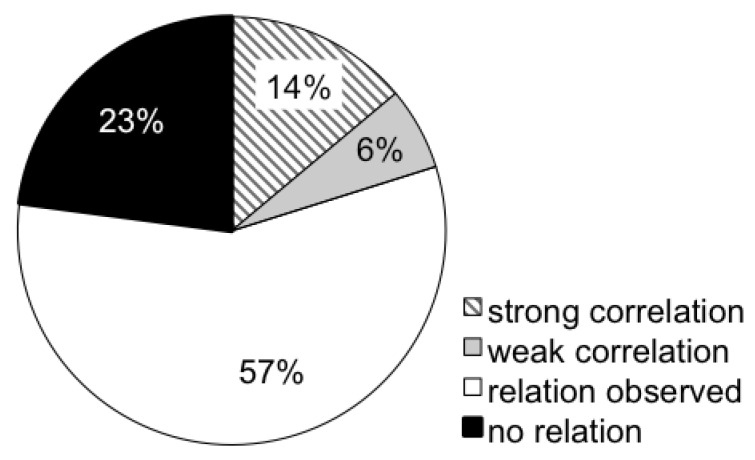
Fig 5.
Overview of relations of [18F]FLT with parameters of cellular proliferation. This pie chart depicts the relations observed in the studies investigated in this review. Cellular proliferation comprises immunohistochemistry of Ki67, PCNA, BrdU and TK1, as well as TK1 activity or expression analyses. Supplementary Fig. S10 depicts the respective data sorted more specifically for TK1 and other markers of proliferation. “Relation observed” relates to non-quantitative observational studies. Correlations with correlation coefficients > 0.7 were considered strong.

