Figure 5.
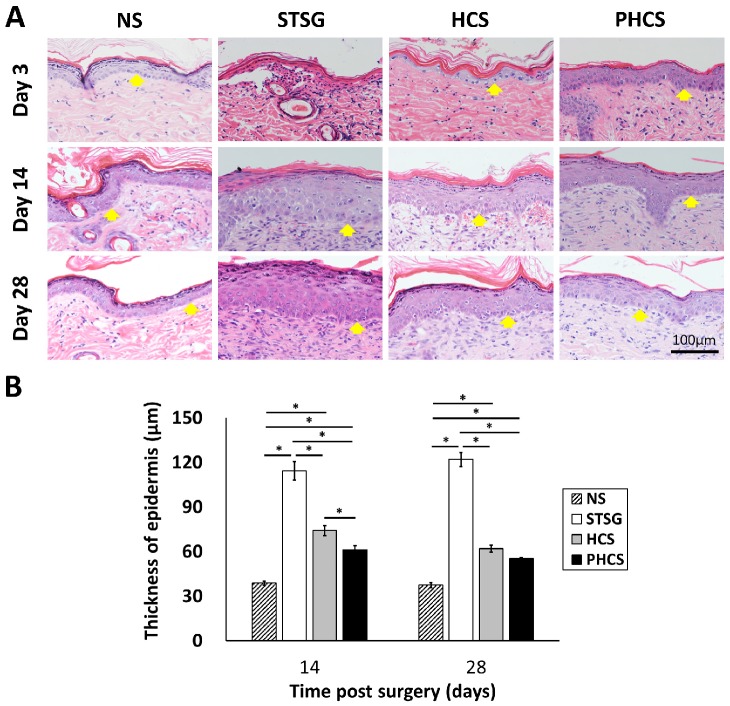
Characterization of epidermis in different grafting groups and normal skin (NS). (A) HE staining of epidermis. Yellow arrows show the position of epidermis. (B) Thickness of epidermis on day 14 and 28. *p < 0.05. The PHCS group had the least amount of skin fibrosis and the epidermis thickness was close to that of normal skin.

