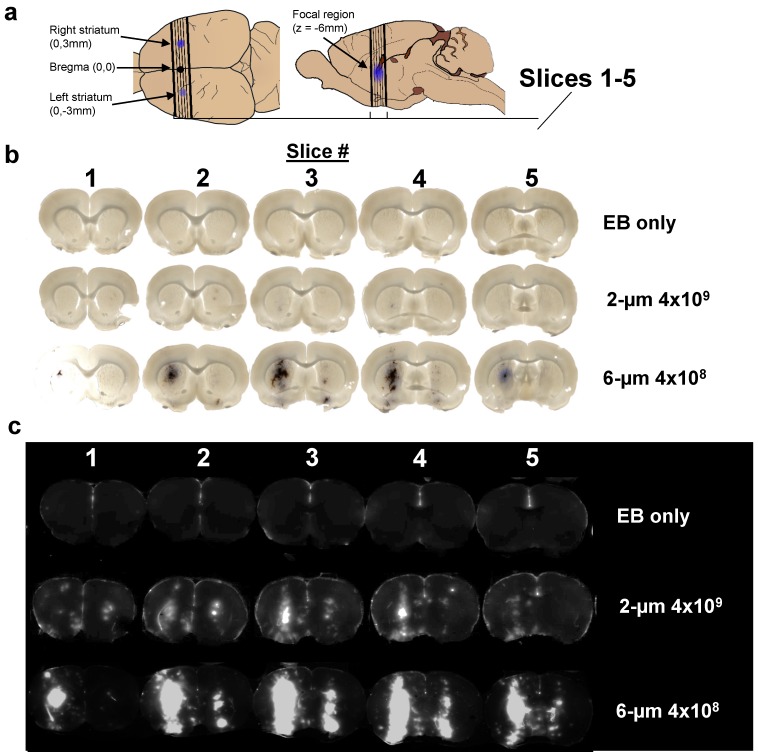
Figure 3.
Imaging results. a) Location of sections used to measure Evans Blue permeabilization within left and right striatum, and brain slices analyzed for LICOR measurements. b) Brightfield microscopy and c) NIR images of three representative brains out of 11 discrete conditions (n = 3 per condition) of 2% EB, no-microbubbles “EB only”; 2% EB, 2-µm, 4×109 MB/kg dose; and 4% EB, 6-µm 4×109 MB/kg dose.

