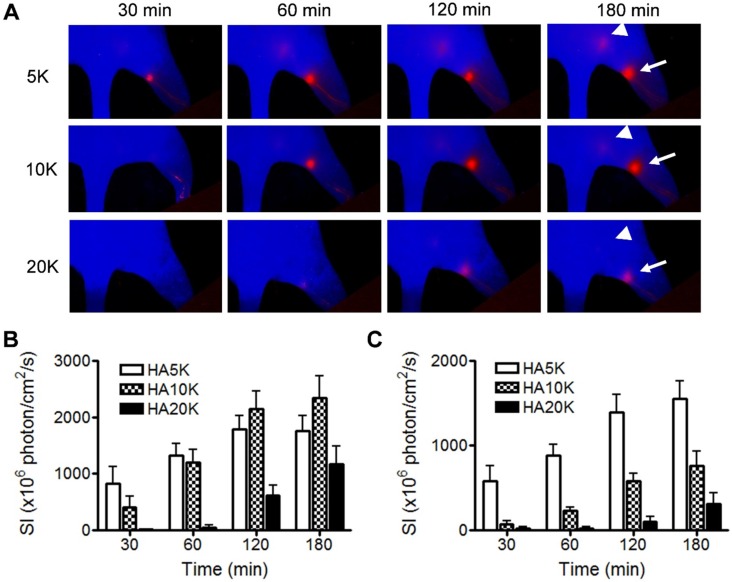
Figure 3.
Comparison of Cy5.5-HA of different sizes as to migration and retention. (A) Representative fluorescent images after intradermal injection of 5K, 10K, or 20K Cy5.5-HA into the right paw. The images were acquired at different times after Cy5.5-HA injection using an orange filter set (excitation 605 nm, emission 645 nm longpass). Popliteal (arrows) and sciatic (triangles) LNs were visualized at different times in a size-dependent manner. Quantification of signal intensity from popliteal (B) and sciatic (C) LNs.

