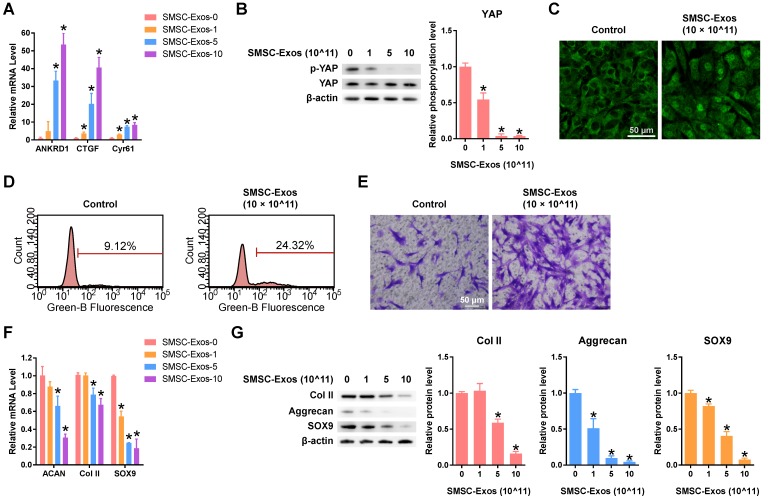
Figure 2.
Responses of articular chondrocytes stimulated by SMSC-Exos. (A) Changes in the expression of the representative downstream genes ANKRD1, CTGF and Cyr61 following YAP activation. SMSC-Exos-0, 1, 5 and 10 indicates that 0, 1, 5, or 10 × 1011 exosome particles/mL were used in the corresponding groups. This experiment was repeated three times. *P < 0.05 compared to SMSC-Exos-0. (B) Representative pictures of de-phosphorylation of YAP, reflecting its activation, and the results of statistical analysis of three replicates. *P < 0.05 compared to SMSC-Exos-0. (C) Subcellular localization of YAP detected using confocal immunofluorescence microscopy. This experiment was repeated independently three times and representative results are shown. Scale bar: 50 μm. (D) EdU assays performed using flow cytometry. The percentage of EdU-positive cells (labelled green) was determined. This experiment was repeated independently three times and representative results are shown. (E) Chondrocyte migration assays. Migrated chondrocytes were stained by crystal violet. This experiment was repeated independently three times and representative results are shown. Scale bar: 50 μm. (F) Gene expression changes of Aggrecan (ACAN), Type II Collagen (Col II) and SOX9 after stimulation with different concentrations of SMSC-Exos. This experiment was repeated three times. *P < 0.05 compared to SMSC-Exos-0. (G) Protein expression levels of Col II, Aggrecan and SOX9 were detected by western blotting and the results of statistical analysis of three replicates are also shown. *P < 0.05 compared to SMSC-Exos-0.

