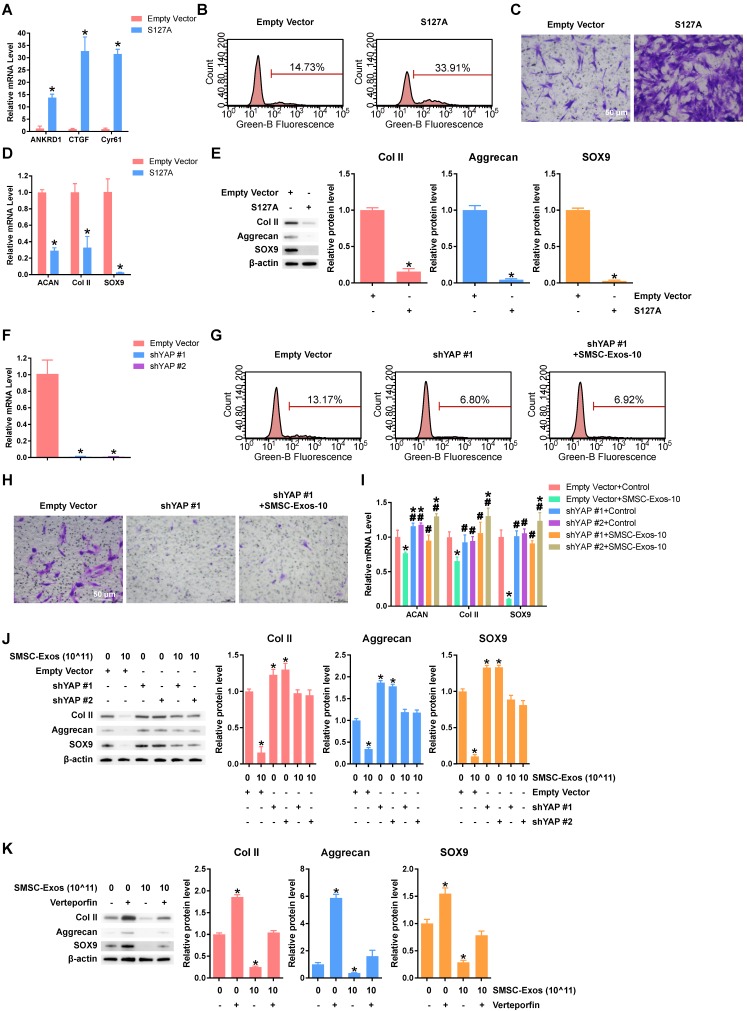
Figure 4.
YAP plays an important role in mediating the effects of SMSC-Exos stimulation. (A) Representative gene expression levels of YAP downstream genes after chondrocytes were transfected with empty vector or S127A. This experiment was repeated three times. *P < 0.05 compared to empty vector. (B) EdU assays were performed, using chondrocytes transfected with empty vector or S127A. The percentage of EdU-positive cells (labelled green) was determined. This experiment was repeated three times. (C) Migration of chondrocytes after transfection with empty vector or S127A. Migrated chondrocytes were stained with crystal violet. This experiment was repeated three times. Scale bar: 50 μm. (D) Gene expression levels of Aggrecan, Col II and SOX9 after chondrocytes were transfected with empty vector or S127A. This experiment was repeated three times. *P < 0.05 compared to empty vector. (E) Protein levels of Aggrecan, Col II and SOX9 were analysed using western blotting. The results of statistical analysis of three independent replicates are also shown. *P < 0.05 compared to Empty Vector. (F) YAP gene expression levels after chondrocytes were transfected by shYAP #1 or shYAP #2. This experiment was repeated three times. *P < 0.05 compared to empty vector. (G) EdU assays were performed on chondrocytes transfected with empty vector or shYAP #1 with or without SMSC-Exos treatment, at a concentration of 10 × 1011 exosome particles/mL. This experiment was repeated three times. (H) Chondrocyte migration assays. Migrated chondrocytes were stained by crystal violet. This experiment was repeated three times. Scale bar: 50 μm. (I) Chondrocytes, transfected with empty vector, shYAP #1 or shYAP #2, were treated with or without SMSC-Exos at a concentration of 10 × 1011 exosome particles/mL. This experiment was repeated three times. *P < 0.05 compared to chondrocytes transfected with empty vector without exosome treatment (Empty Vector+Control). #P < 0.05 compared to chondrocytes transfected with empty vector with SMSC-Exos treatment, at a concentration of 10 × 1011 exosome particles/mL (Empty Vector+SMSC-Exos-10). (J-K) Protein expression levels of Col II, Aggrecan and SOX9 were analysed using western blotting. The results of statistical analysis of three independent replicates are also shown. *P < 0.05 compared to control.

