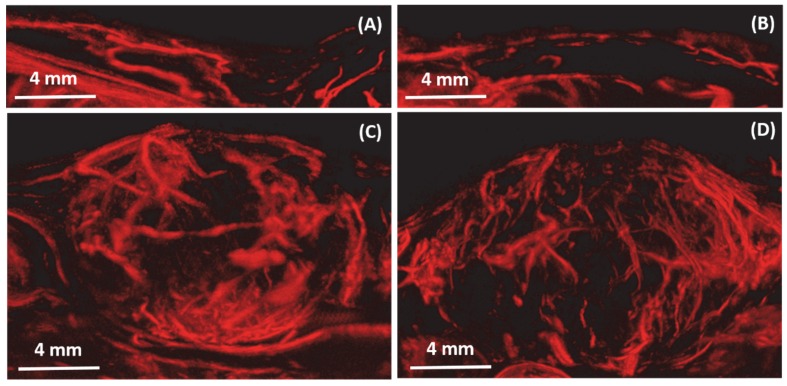
Figure 5.
In vivo: Maximum intensity projection through three-dimensional ULM image data for four rats. The resulting two-dimensional images are orientated in the sagittal anatomic plane. Vessel density and morphological differences are obvious between the control rats (A, B) and tumor rats (C, D). Bar = 4 mm.

