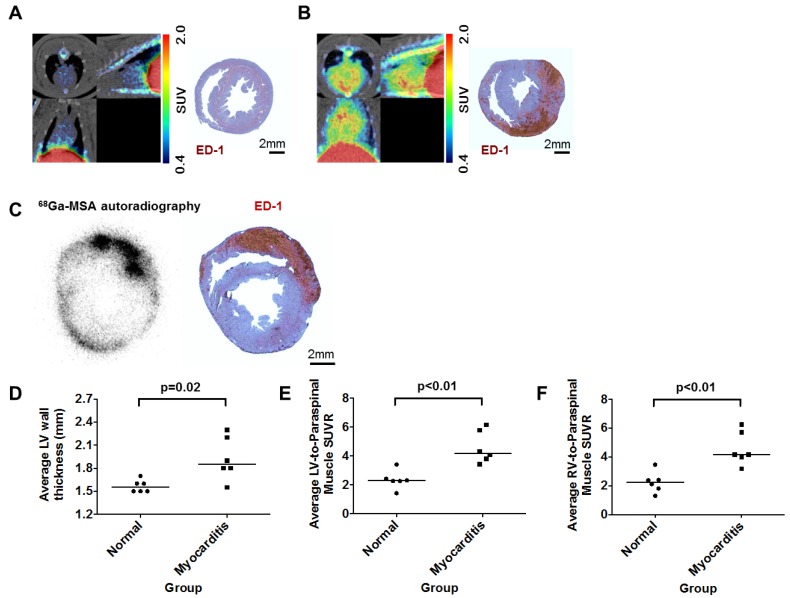
Figure 4.
68Ga-NOTA-MSA PET imaging for the diagnosis of myocardial inflammation in myocarditis rats. (A and B) Representative 68Ga-NOTA-MSA images and the corresponding ED-1 staining results for inflammatory cells (brown color) in normal (A) versus myocarditis (B) rats. Higher 68Ga-NOTA-MSA was noted in the myocarditis rats compared with the normal rats, which was corroborated by the massive infiltration of inflammatory cells in the immunohistochemistry. (C) The 68Ga-NOTA-MSA uptake pattern in the myocardium by autoradiography colocalizes with the pattern of inflammatory cell infiltration by ED-1 immunostaining (brown color) in rat myocarditis. (D) Significantly thicker left ventricle (LV) wall in the myocarditis rats compared with the normal rats by M-mode echocardiography. (E and F) Significantly higher average 68Ga-NOTA-MSA uptake at the LV (E) and the right ventricle (RV) (F) in the myocarditis rats compared with the normal rats. The median value of each groups are shown as horizontal lines in (D), (E) and (F). SUV(R), standardized uptake value (ratio).

