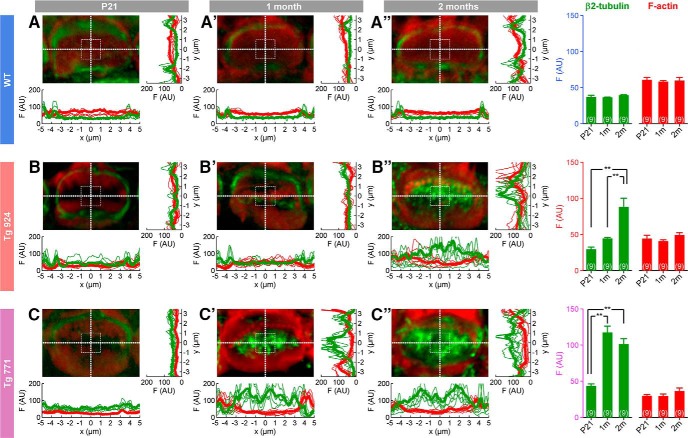
Figure 8.
Microtubule network remodeling in IHCs of diap3-overexpressing mice. A–C″, Fluorescence intensity distribution of microtubules (green) and F-actin (red) at the cuticular plate section through x and y sections in WT (A–A″), Tg 771 (B–B″) and Tg 924 (C–C″) lines at P21 (A, B, C), 1 month (A′, B′, C′), and 2 months (A″, B″, C″). Actin filaments are labeled using phalloidin-rhodamine (red), and microtubules are stained using an antibody against the β2-tubulin subunit (green). Pictures show a high magnification of the cuticular plate section over a single IHC. Thick and thin lines represent the average and individual fluorescence intensities (n = 9 IHCs in each condition), respectively. Right, histograms show the fluorescence average from an area of 4 µm2 located at the image center for the different genotypes and age. AU, arbitrary unit. **p < 0.01 (Student’s t-test).

