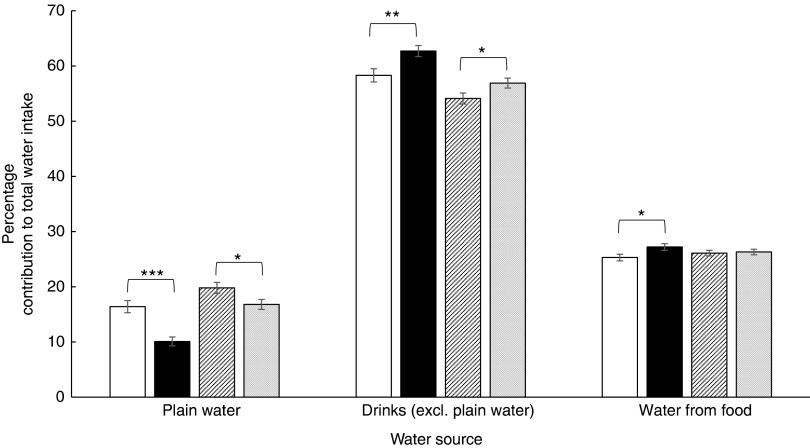
Fig. 3.
Percentage contribution of different sources of water by glycated Hb (HbA1c)
categories (low cardiometabolic risk <5·5 %(
26
–
28
); increased cardiometabolic risk 5·5–6·49 %(
26
–
27
)). Values are means, with their standard errors represented by vertical
bars. Differences tested using Kruskal–Wallis test. * The difference in intakes
between HbA1c categories is significant (P<0·05). ** The
difference in intakes between HbA1c categories is significant
(P=0·007). *** The difference in intakes between HbA1c categories is
significant (P<0·001).  , Men <5·5 %
(n 221);
  , men ≥5·5 % (n 235);
 , women <5·5 % (n
295);
  , women ≥5·5 % (n 284).
Excl., excluding.

