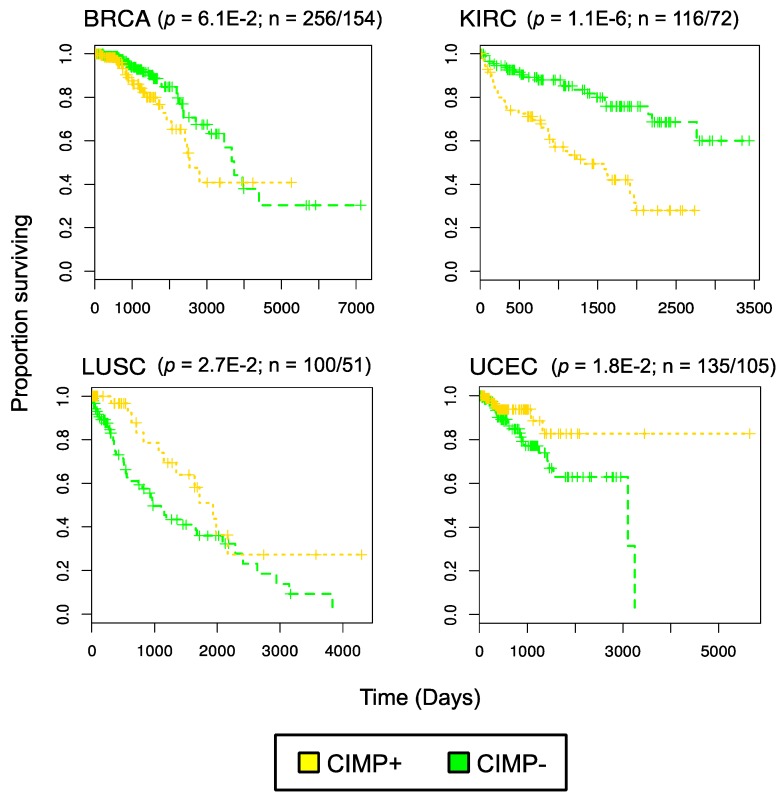
Figure 3.
Survival curves in four cancer types based on CIMP: figure reproduced from [62] and published by BioMed Central. Data generated using The Cancer Genome Atlas clinical data for these cancer types. p values were determined using a log-rank test for survival differences. Ratio (n) indicates number of CIMP-/CIMP + samples.

