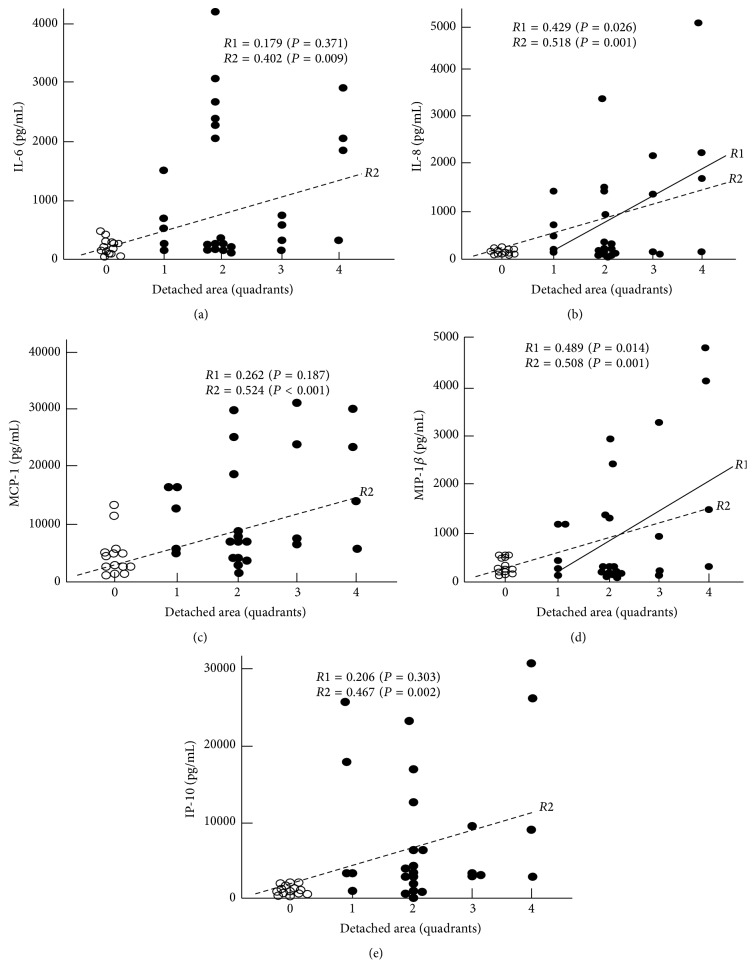
Figure 3.
Correlations observed between the extent of RD and the IL-6, IL-8, MCP-1, MIP-1β, and IP-10. R1 with a solid regression line indicates Pearson's correlation coefficient when the MH data were not included, while R2 with a broken regression line indicates that the MH data were included as a detached area of the 0 quadrant.

